Figure 4.
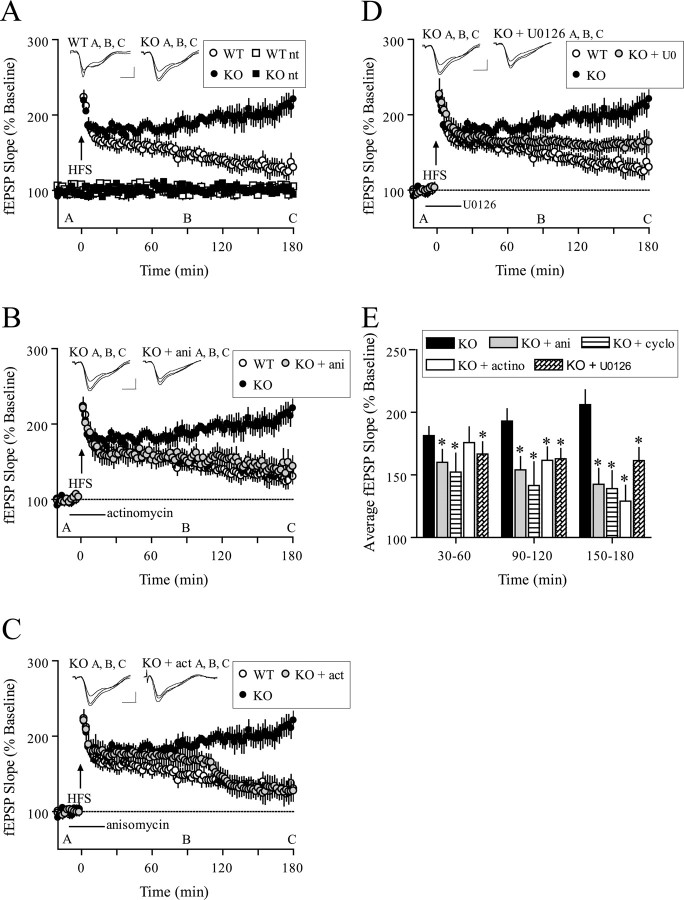
Facilitated L-LTP in 4E-BP2 knock-out mice. A, A single 100 Hz train (1 s) evoked E-LTP in wild-type slices that decayed to baseline after 3 h but evoked L-LTP in knock-out slices that endured for at least 3 h (n = 10 slices; 8 mice per genotype; p < 0.0001; ANOVA). Representative fEPSP recordings from time points A, B, and C are shown for each condition. Calibration: 1 mV, 10 ms. B, Facilitated LTP induced by one 100 Hz train in knock-out slices was reversed by anisomycin (ani; 40 μm) after 45 min to a level indiscernible from wild-type slices (wild-type, n = 10; knock-out, n = 10; KO + ani, n = 8; p < 0.0001; ANOVA). C, Facilitated LTP induced by one 100 Hz train in knock-out slices was reversed by actinomycin-D (actino; 40 μm) after 90 min to a level indiscernible from wild-type slices (wild-type, n = 10; knock-out, n = 10; KO + actino, n = 8; p < 0.0001; ANOVA). D, Facilitated L-LTP-induced 100 Hz train in knock-out slices was attenuated by U0126 (20 μm) (wild-type, n = 10; knock-out, n = 10; KO + U0126, n = 8; p < 0.0001; ANOVA). E, Compilation bar graph depicting average fEPSP slopes for the time periods indicated. *p < 0.05 (t test) compared with knock-out for the given time periods. WT, Wild-type; KO, knock-out.

