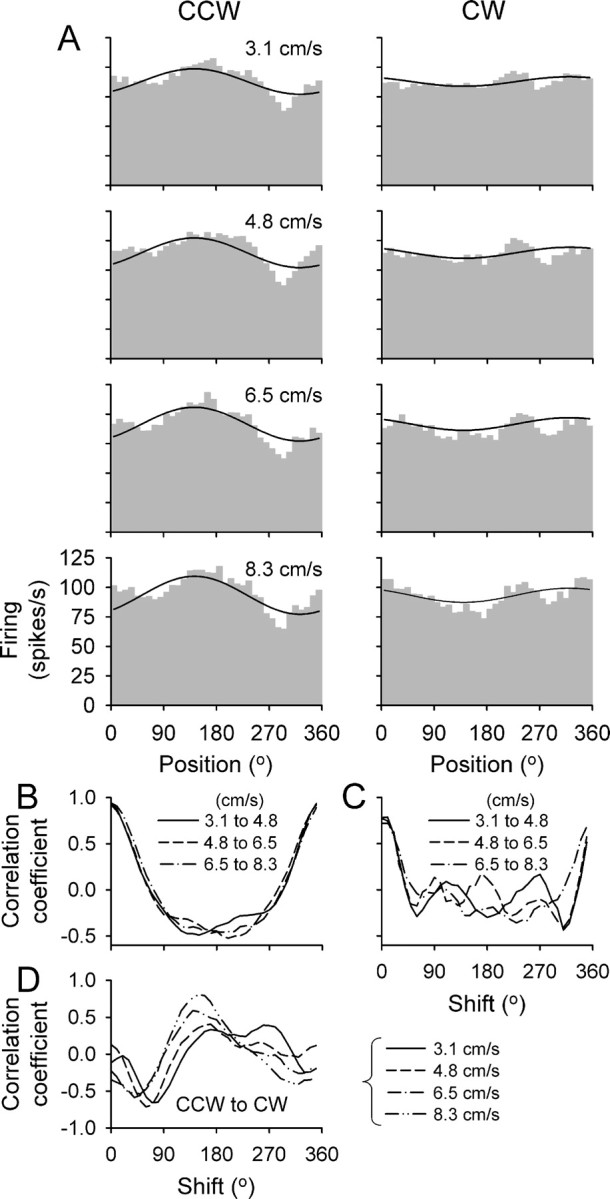
Figure 10.

Example of nonharmonic discharge modulation. A, Simple spike histograms are shown for four speeds for CCW (left column) and CW (right column) tracking. The solid black line is the fit of the UPVS model. B, C, Cross-correlograms between discharge rates for the three pairs of speed conditions shown in A for CCW and CW tracking, respectively. D, Cross-correlograms between discharge rates of CCW and CW tracking for each of four target speeds. Plotted in B-D are the cross-correlation coefficients as functions of the angular shift between the two firing profiles.
