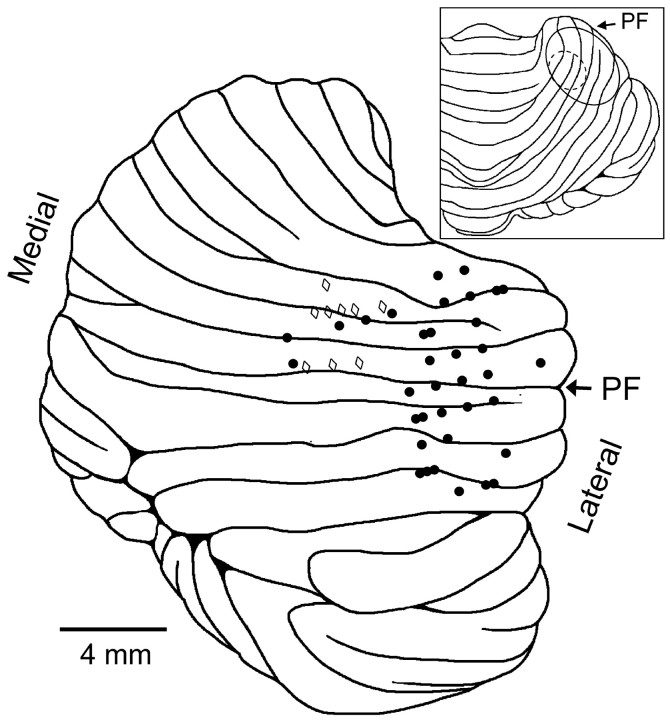
Figure 3.
Recording sites in two animals, H and M. Shown is the lateral view of the cerebellum with the locations of electrode penetrations for monkey H (filled circles, right side of the cerebellum) and those for monkey M (open diamonds) mapped from the actual side (left) to the right side of the cerebellum. The primary fissure is marked with the arrow labeled PF. Only recording sites for the 46 cells used in the analysis from H and M are displayed (some recording sites correspond to several cells). Inset shows dorsal view of the cerebellum, with the ovals denoting the penetration regions for animals H (solid line) and M (dashed line).

