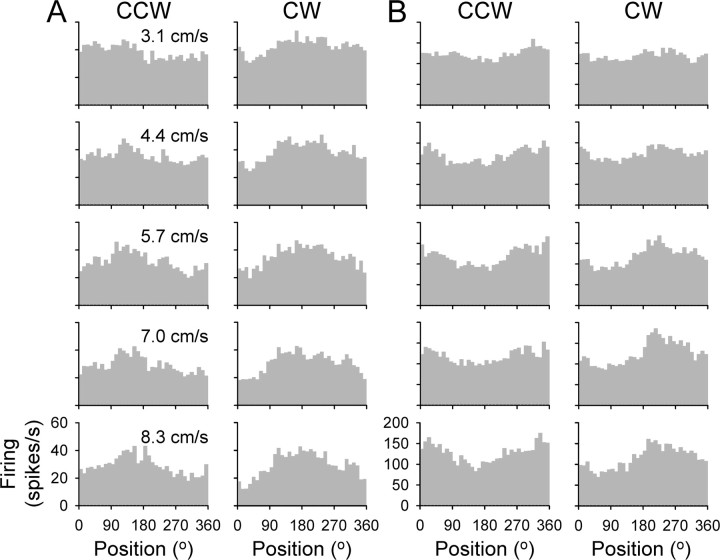
Figure 4.
Histograms of the simple spike discharge from two example Purkinje cells. A, Track period firing for CCW (left column) and CW (right column) tracking across all target speeds (3.1, 4.4, 5.7, 7.0, and 8.3 cm/s, top to bottom row) for one example Purkinje cell. B, Same for another example Purkinje cell. Histograms represent the average firing rate in 10° bins and are the average of 30 trials.

