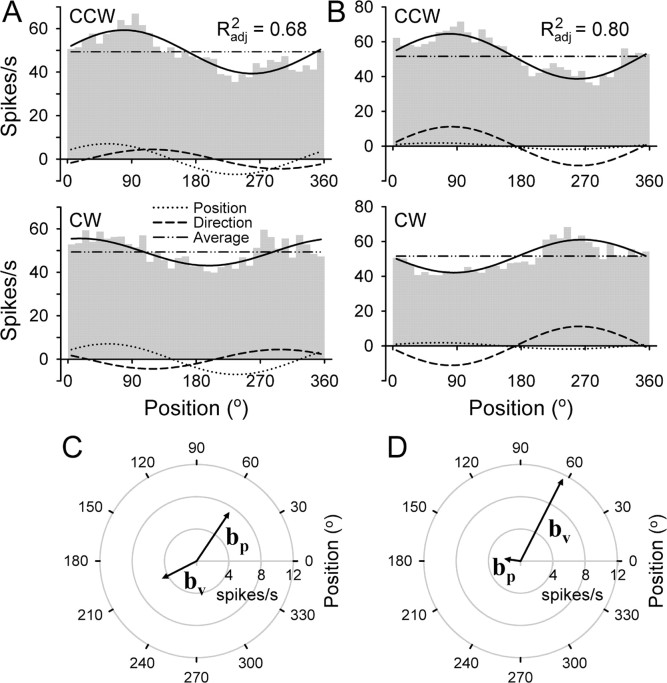
Figure 6.
Illustration of the UPV model. A, B, Plotted are the histograms and fits for the two Purkinje cells shown in Figure 5. The overall fit is shown by the solid black line with the total adjusted R2 as indicated. The fit involves both directions of tracking. The contribution of individual model components of position, direction of movement, and average firing are also shown. C, D, Diagrams displaying the preferred vectors, bp and bv.

