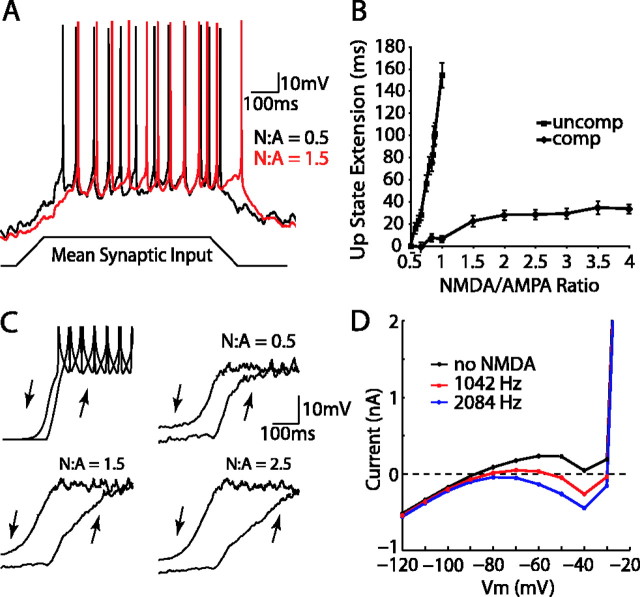
Figure 5.
Increasing the NMDA/AMPA (N:A) ratio contributes to hysteresis in the MSP model membrane potential during synaptic input ramps. A, An NMDA/AMPA ratio of 1.5 (red trace) results in a delayed and extended up state compared with a 0.5 NMDA/AMPA ratio (black trace) in a synaptic input ramp experiment. The same input stimulus consisting of a ramp up, plateau, and ramp down was used for both traces and is indicated at bottom. B, The average extension of the up state for both uncompensated (squares) and compensated (diamonds) NMDA/AMPA ratios. Each point represents the mean extension of the up state past control (defined by time of last spike) for 48 simulations (error bars indicate SD). C, The model cell Vm takes different paths between states depending on transition direction and NMDA/AMPA ratio. Top left, The path of the Vm from down to up state is only slightly different under current injection. As NMDA/AMPA ratio increases from 0.5 to 1.5 to 2.5, the transitions become increasingly more distinct from one another in time. Each subplot is the average Vm of 48 trials reflected at the midpoint of the symmetrical ramp input. D, Steady-state current after steps to a range of voltages during somatic voltage clamp (see Materials and Methods). NMDA activation via synaptic stimulation at 1042 Hz (red trace) and 2084 Hz (blue trace) enhances the negative slope conductance and causes a double crossing of the zero-current axis at an input frequency of 1042 Hz.

