
Figure 1.
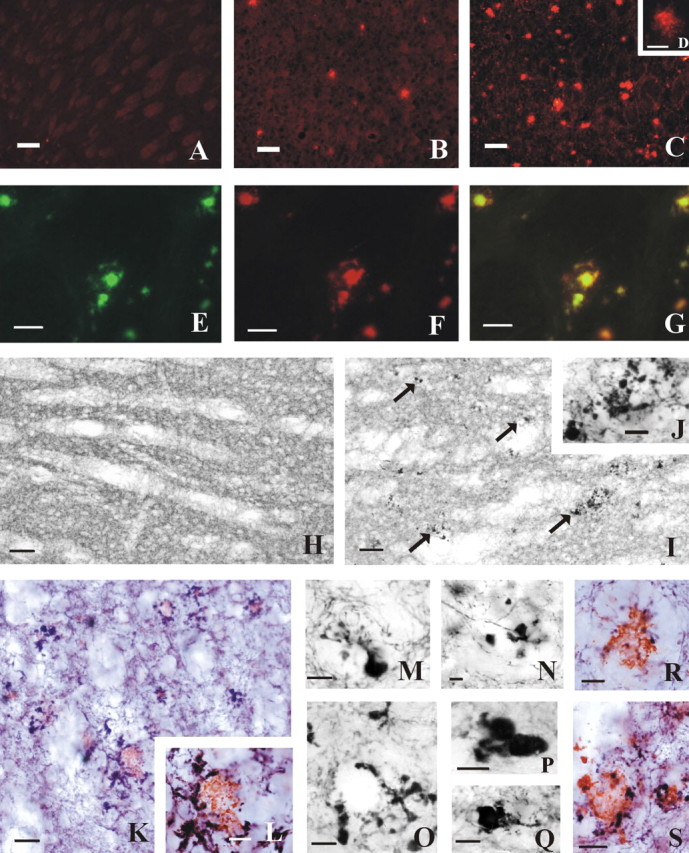
Photomicrographs of the striatum displaying TH-IR Aβ-IR plaques and dystrophic neurites in APPswe/PS1ΔE9 tg mice and wt mice. A-C, Confocal images showing age-related progression of striatal Aβ-IR plaques in APPswe/PS1ΔE9 tg mice. A, Lack of Aβ immunoreactivity at 3 months of age compared with the increase of Aβ deposition between 6 (B) and 12 (C) months of age. D, Higher-power image showing detail of an Aβ-IR plaque from a 12-month-old APPswe/PS1ΔE9 tg mice. E-G, Coronal striatal images showing single and double staining for thioflavine-S (E) and Aβ (F) in a 12-month-old APPswe/PS1ΔE9 mice. G, Merged image showing the colocalization of both markers in the plaque core (yellow), whereas the periphery was only Aβ positive (red). H-I, Bright-field photos of horizontal sections of the striatum from a 13-month-old wt mouse (H) showing the absence compared with the presence of numerous TH-IR dystrophic neurites (arrows) in a 15-month-old APPswe/PS1ΔE9 tg mouse (I). J, Higher-power image of a cluster of TH-IR dystrophic neurites shown in I. K, Horizontal section of the striatum of a 15-month-old APPswe/PS1ΔE9 tg mouse illustrating Aβ-IR plaques (red) surrounded by TH-IR dystrophic neurites (blue). L, Higher-power image of an Aβ-IR plaque from K showing swollen TH-IR dystrophic neurites. M-R, Examples of TH-IR dystrophic neurites in the striatum of 4- (M), 7.5- (N), and 10- (O-Q) month-old APPswe/PS1ΔE9 tg mice showing rosette-like patterns (M-O) and other aberrant profiles (P, Q). R, S, Higher-power image of Aβ-IR plaques (red) surrounded by TH-IR dystrophic neurites (blue) in the striatum of a 4- and a 17-month-old mutant mouse, respectively. Scale bars: A-C, 60 μm; D, 20 μm; E-G, 30 μm; H, I, 40 μm; J, K, S, 10 μm; L-Q, 7 μm.