
Figure 2.
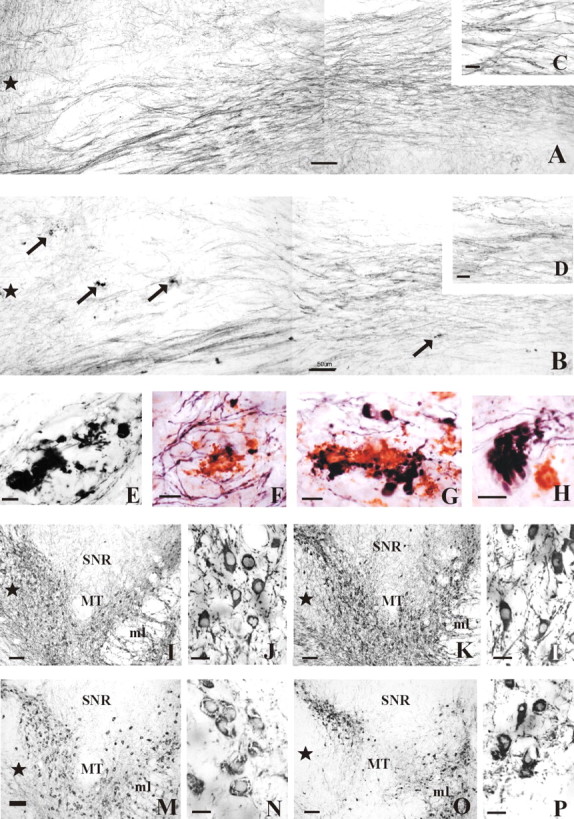
Photographs of the nigrostriatal bundle and the SN of APPswe/PS1ΔE9 tg and wt mice. A, B, Photomontages of horizontal sections showing TH-IR fibers within the nigrostriatal bundle of a 16-month-old wt (A) and 17-month-old APPswe/PS1ΔE9 tg (B) mouse. Note the presence of numerous TH-IR dystrophic neurites (arrows) and the relative decrease in the density of TH-IR fibers in bundle in the APPswe/PS1ΔE9 (B) compared with the wt (A) mouse. C, D, Insets showing detail of the TH-IR fibers of the nigrostriatal bundle from A and B, respectively. E, Example of swollen TH-IR dystrophic neurites observed in the nigrostriatal bundle in a 17-month-old mutant mice. F-H, Higher-power image of Aβ-IR plaques and/or TH-IR dystrophic neurites observed in the nigrostriatal bundle of a 17-month-old transgenic mice. Note the different shapes and sizes of the dystrophic neurites (blue) adjacent to the Aβ-IR profiles (red) (F, G), as well as an example of the grape-like neurite morphology (H). I, M, Photomicrographs of horizontal sections of nigral TH-IR neurons of a 7-month-old wt and a 7.5-month-old APPswe/PS1ΔE9 tg mouse, respectively. Note the strong TH neuronal immunoreactivity in the wt mice (I) compared with that seen in APPswe/PS1ΔE9 tg mice (M). J, N, Higher-power images of the TH-IR neurons shown in I and M, respectively. K, O, TH-IR neurons in the SN of a 16-month-old wt mouse and a 17-month-old APPswe/PS1ΔE9 tg mouse, respectively. L, P, Higher-power images of the SN neurons seen in K and O, respectively. Note the decrease of TH-IR processes in O as well as the shrunken appearance of TH-IR neurons with blunted dendritic processes in the SN (P). Stars indicate the rostral direction. SNR, Substantia nigra, pars reticulata; ml, medial lemniscus; MT, medial terminal nucleus accessory optic tract. Scale bars: A, B, I, K, M, O, 50 μm; C, D, E-H, 10 μm; J, L, N, P, 20 μm.