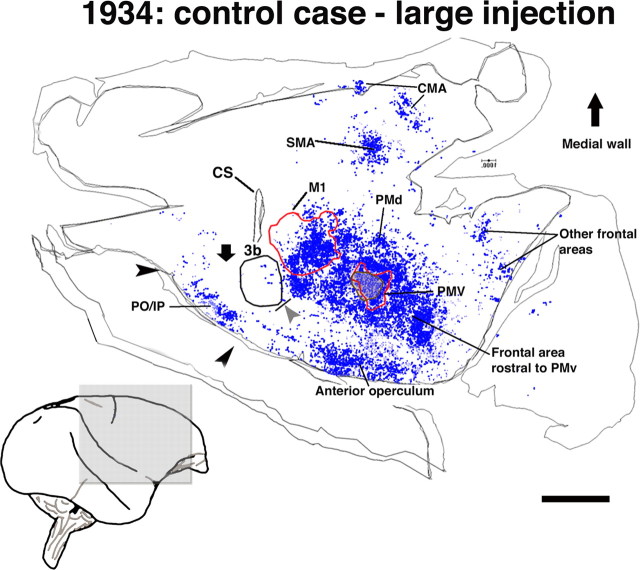
Figure 2.
Pattern of terminal labeling from PMv in control animals. Reconstruction of the typical distribution of terminals observed in flattened, tangential sections through the frontoparietal cortex in a control case (1934; large injection, 2 sections). Because this animal received the largest BDA injection of any in the study and displayed the most extensive and densest distribution of terminals, it provides a reasonable estimate of the limits of normal PMv connectivity. Contours delineate physiologically or histologically defined areas. A gray arrowhead indicates the location of the hand/face septum. A black downward arrow indicates the location of area 1/2 of S1. Terminal labeling in the frontal cortex was found in areas rostral to PMv, the anterior operculum, the rostrolateral portion of M1, the PMd, and the SMA. Terminal labeling in the parietal cortex was confined primarily to the posterior operculum/inferior parietal cortex (PO/IP; area 7b, S2, and PV; black arrowheads) and the posterior parietal cortex. Very sparse labeling can be seen in the primary somatosensory cortex. CS, Central sulcus; CMA, cingulated motor area. Scale bar, 5 mm.

