
Figure 7.
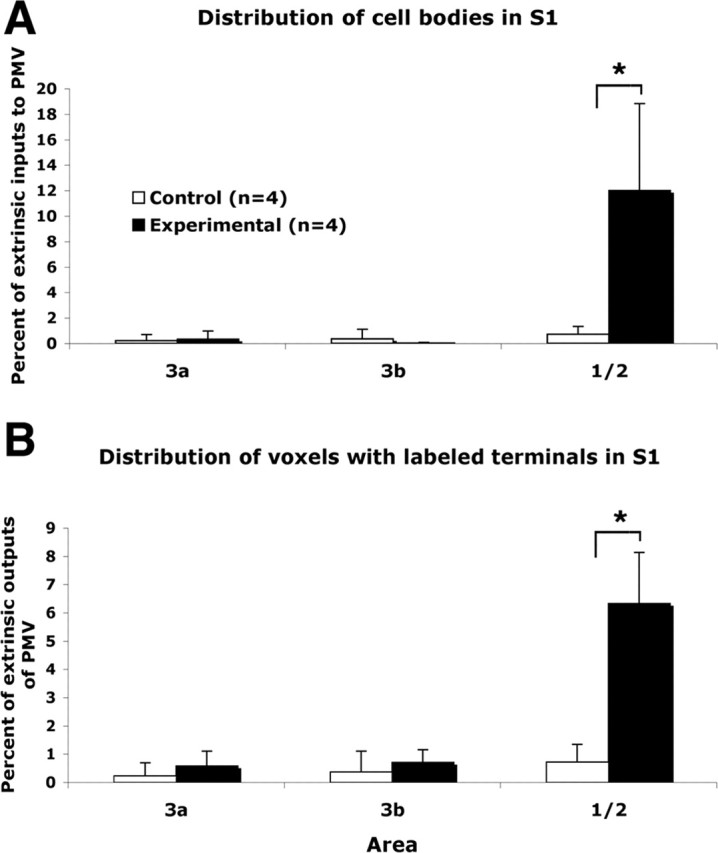
Distribution of labeled cell bodies and terminals in S1. Distribution of labeled cell bodies and (voxels with labeled) terminals in areas 3a, 3b, and 1/2 of control and experimental cases. Proportions of extrinsic PMv inputs and outputs are shown. *p < 0.05, statistically significant differences.