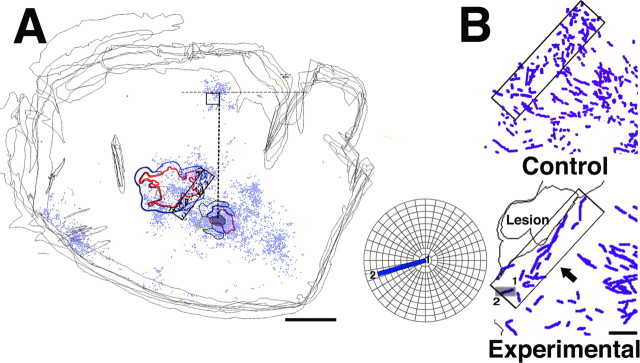
Figure 9.
Quantitative analysis of fiber trajectories. A, Reconstruction of sections in control case 9409 (small injection). Hand representations of M1 and PMv are outlined. Locations of labeled terminals are shown as blue dots. For quantitative analysis, each section was aligned vertically, using a line drawn between the middle of the injection site and the cluster of BDA labeling found in SMA. A rectangular analysis window of constant dimensions and orientation was then positioned at the rostral border of the M1 hand representation, within the zone of termination. Orientations of every axonal segment within the analysis window were plotted and analyzed for each section of each case. Scale bar, 5 mm. B, Top, Reconstruction of large fibers in control case 9409 (4 sections superposed). In general, axons were relatively short and had scattered orientations. Rectangle indicates 1.2 × 5.0 mm analysis window. Bottom, Reconstruction of large fibers at the border of the lesion in experimental case 9406 (2 sections superposed). In each case in the experimental group, many axons coursed along the rostral border of the M1 lesion for several millimeters. Small gray rectangle indicates the location of a sample axonal segment that is enlarged and displayed on a polar plot in the inner panel. The beginning of the segment is indicated by 1 and the end by 2. This particular axon segment had an orientation of 163°. In the quantitative analysis, orientations were grouped into 10° bins. Thus, this axon segment was tallied in the 160-170° bin (also see Fig. 10 and Materials and Methods). Scale bar, 1 mm.

