Figure 3.

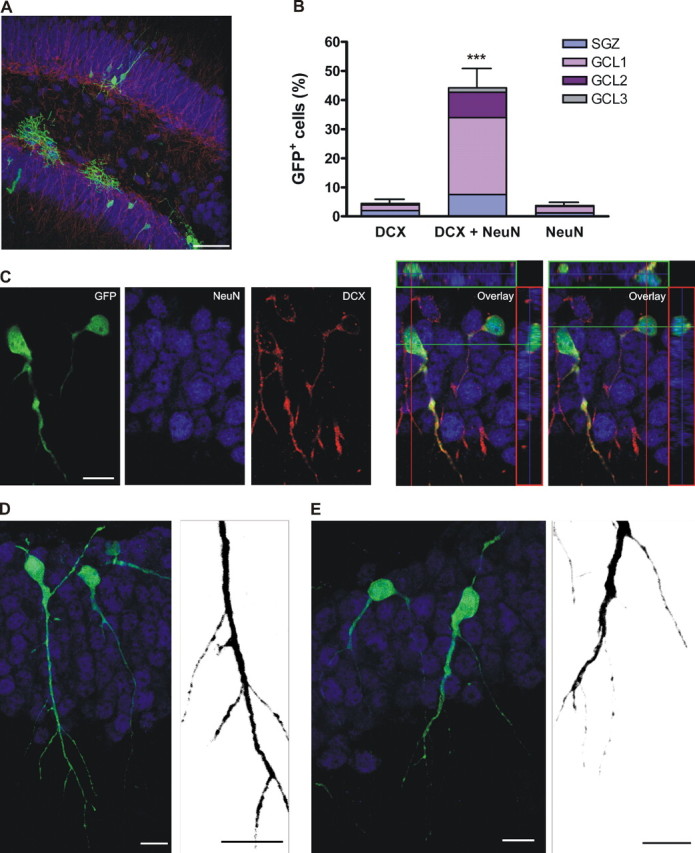
Morphological features of class C neurons at 14 dpi. A, Transverse section of the DG showing the localization of GFP+ cells. The image is a merge of 27 confocal planes. Scale bar, 50 μm. B, Distribution of GFP+ cells expressing neuronal markers, normalized to the total number of GFP+ cells. Bars show mean ± SEM percentage of cells expressing the corresponding marker (n = 399 GFP+ cells from 6 mice).***p < 0.001 by ANOVA with post hoc Bonferroni's test. C, Example of two adjacent neurons expressing DCX and NeuN in the same optical section and the overlays together with their corresponding orthogonal projections. D, E, Examples of class C neurons. Images are projections of 23 (D) and 12 (E) optical sections. Micrographs taken with a higher digital zoom (right panels) depict details of spineless dendrites (merge of 11 and 5 confocal planes taken at 0.7 μm intervals, respectively). Cells shown in E are the same as in C but rotated 180° for clarity. Scale bars: C-E, 10 μm.
