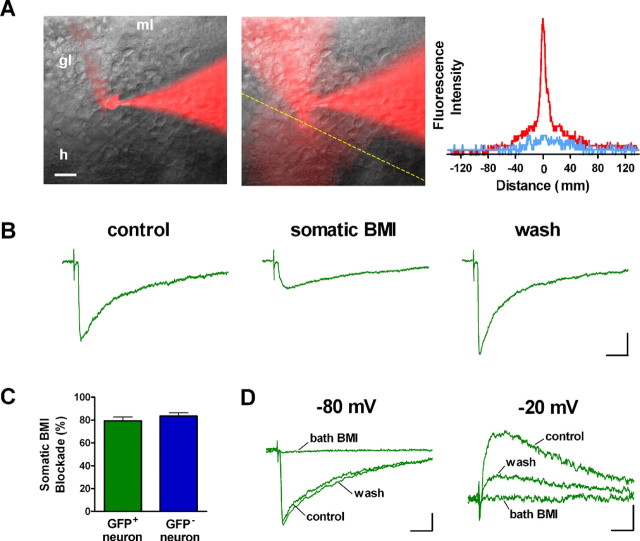
Figure 8.
Somatic blockade of fast GABAergic evoked PSCs. A, Merged fluorescent and bright-field images before (left) and during (middle) focal application of BMI in a whole-cell recording, with Alexa Fluor 594 included in the recording and puffing pipettes. ml, Molecular layer; gl, granule layer; h, hilus. Fluorescence intensity (arbitrary units) measured at the yellow dashed line before (blue) and during (red) BMI perfusion is shown to the right. B, GABAergic evoked PSCs recorded before (control), during (somatic BMI), and after (wash) somatic application of BMI onto a GFP+ neuron with both GABA and glutamate inputs recorded at Vhold = -80 mV. Calibration: 10 pA, 20 ms. C, Somatic blockade of evoked PSCs was significant for GFP+ (p < 0.002; n = 3; single-sample t test) and GFP- DGCs (p < 0.002; n = 3). Bars represent mean ± SEM. D, Bath application of BMI blocks the slow component of GABAergic PSCs that predominates at Vhold = -20 mV and the mixed fast/slow responses recorded at Vhold = -80 mV in the same GFP+ neuron (percentage blockade at -80 mV, 97.7 ± 0.8%; n = 4; p < 0.0001; single-sample t test). Calibration: 25 pA, 20 ms. All recordings shown in this figure were performed in the presence of kyn (4 mm).

