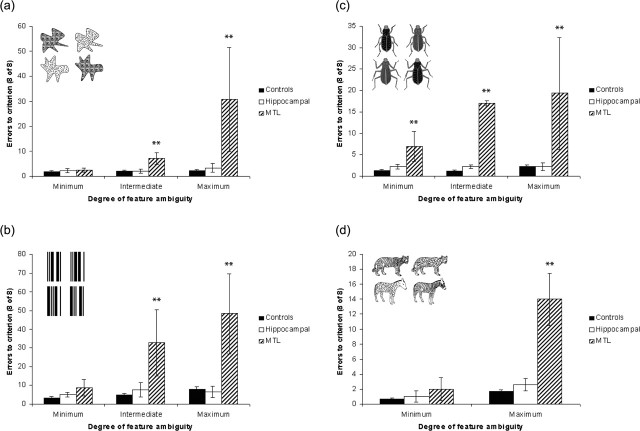
Figure 3.
Mean errors to criterion (8 consecutive correct responses) for the two patient groups and two control groups (averaged) for blobs (a), barcodes (b), bugs (c), and beasts (d) are shown. There was no significant difference between the young and old controls. One MTL patient was unable to achieve the criterion of eight consecutive correct for maximum-ambiguity blobs, intermediate-ambiguity barcodes, and maximum-ambiguity barcodes (>140 trials). Objects used in the maximum-ambiguity condition of each stimulus type are shown on each graph. Correct objects are depicted on the left; incorrect objects are on the right. Error bars represent SEM. **p < 0.01 (MTL group vs control).

