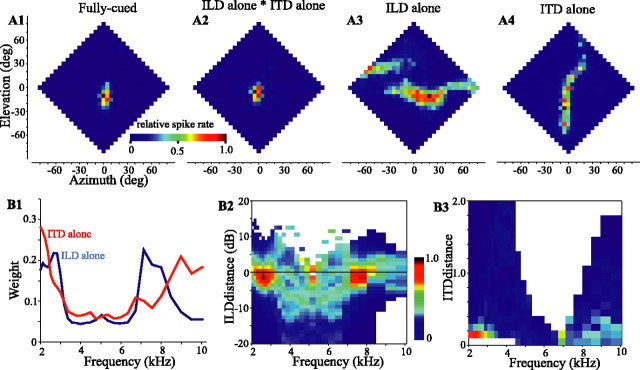
Figure 1.
Responses of an ICx neuron to fully cued (A1), ILD-alone (A3), and ITD-alone (A4) stimuli. Each plot presents the firing rate of the cell, color-coded and normalized over each plot, as a function of azimuth and elevation of the stimulus. Data have been interpolated from a checkerboard pattern obtained at a 10° resolution. In A2, the point-by-point multiplication of A3 by A4 is shown for comparison with A1. B1, Frequency weights for this cell estimated from the response of the cell to frequency-specific differences (dILD, dITD) between the binaural cues for each stimulus location and the optimal of the cell for each cue. The activity of the cell (normalized and color-coded) as a function of frequency and dILD (B2) or dITD (B3) is shown. Cell 939FG is shown. deg, Degree.

