Figure 10.
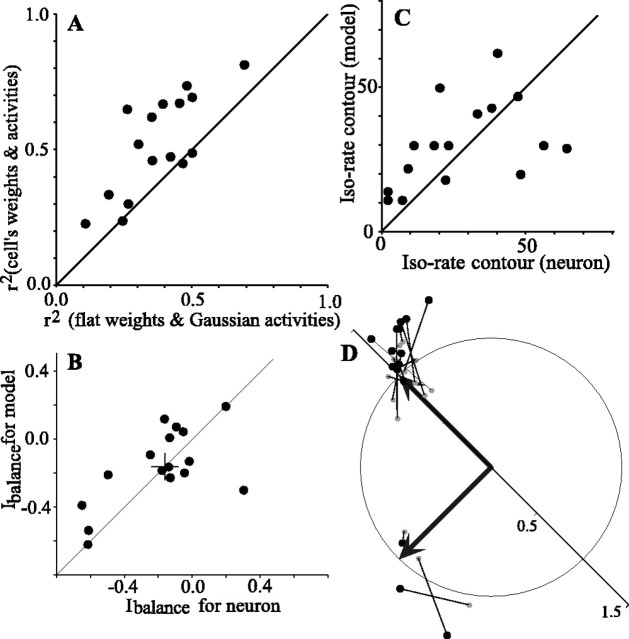
Summary of the output of the model for 16 cells tested with two sources placed diagonally. A, r2 values for the peak of the two-dimensional cross-correlation when using the weights and activities of each cell are plotted against r2 values when using unitary weights and Gaussian activity curves. B, Comparison of the Ibalance, which measures the relative strength of responses to the two sources, for the model and the spike response of the cell. C, The maximum iso-rate contour at which the response areas for the two sources join is compared for the model and the spike responses. D, Orientation and separation of the responses of the model to the two sources. As in Figure 5E, each test is represented as the head of an imaginary vector (large filled circles) pointing from the origin in a direction equivalent to the angle made by the two response areas and with a magnitude equal to the distance between the two response areas normalized by the expected distance. Each modeled response is connected by a line with a small gray dot that shows the equivalent measures for the spike response of the cell. The two thick black arrows represent the expected vectors for the two different diagonal orientations.

