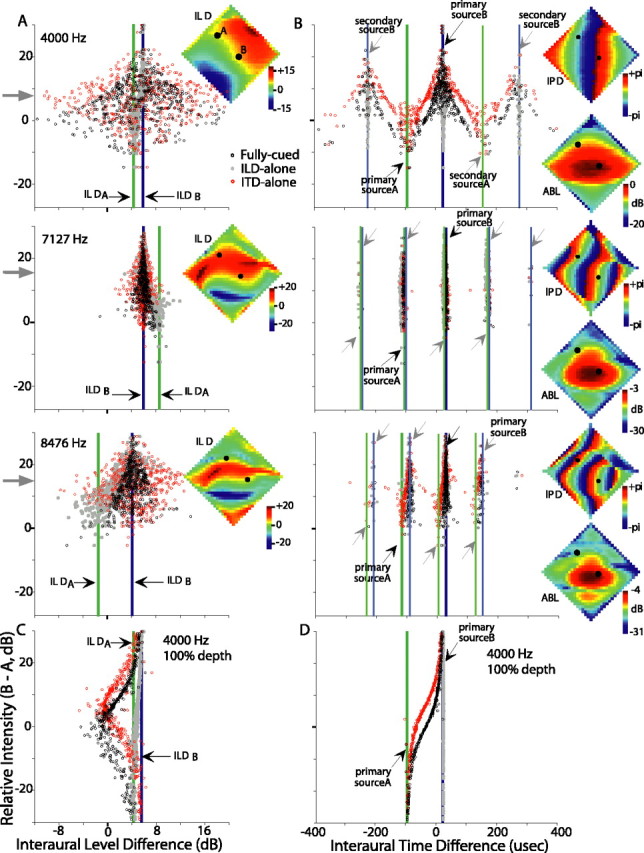
Figure 11.

Binaural cues available from two diagonally arranged sources separated by 40° of azimuth and elevation. Momentary ILD (A, C) and ITD (B, D) cues are plotted against the momentary relative level of the two sources (source B minus source A, decibels). Each circle or dot represents the cue computed within successive 1 ms (nonoverlapping) time windows. The black circles represent fully cued conditions, gray dots represent the ILD-alone condition, and red circles represent the ITD-alone condition. Single-source ILDs and ITDs (primary peaks of the binaural correlogram) are depicted for each source by thick vertical lines (green, source A; blue, source B) and black arrows. Additionally, secondary ITD peaks are indicated by gray arrows and thinner lines in B. In A and B, cues for three frequency bands are shown (top, 4000 Hz; middle, 7127 Hz; bottom, 8476 Hz) when each source is modulated to 50° depth. The 4000 Hz band is shown in C and D for 100° modulation depth. For reference, the spatial distributions of single-source ILD, IPD, and ABL are shown in insets for each frequency band in A and B. ILD and ABL plots are scaled individually; IPD plots use a common scale. Source A is placed at +35° elevation, -25° azimuth and amplitude modulated at 55 Hz. Source B is placed at -5° elevation, +15° azimuth and amplitude modulated at 75 Hz. Black dots within the insets represent these source locations.
