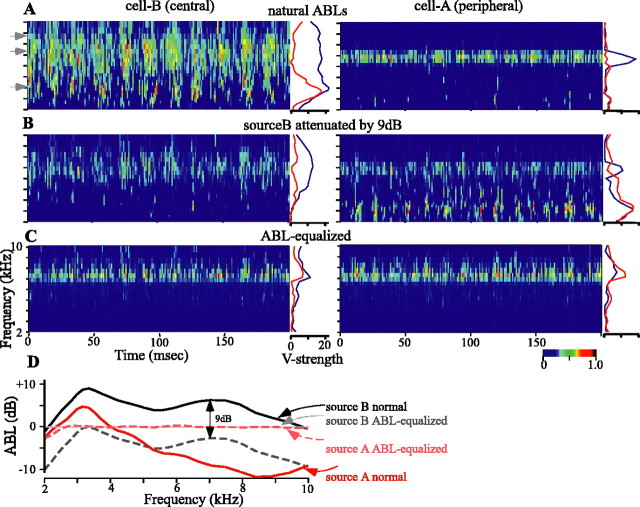
Figure 12.
Modeled activity for two cells with RFs that are centered at the locations of source A (right column) and source B (left column), respectively, as shown in Figure 11. Each plot depicts the activity of the model cell over time and across frequency bands by the color scale at the bottom right. Source A is amplitude modulated at 55 Hz, source B is amplitude modulated at 75 Hz, and the locking within each frequency band to these modulations is shown as the vector strength plotted to the right of each activity plot (red, 55 Hz; blue, 75 Hz). A, Each source presented at the natural ABLs associated with their respective source location. Gray arrowheads indicate frequency bands plotted in Figure 11. B, Source B attenuated by 9 dB. C, Each source presented with nearly equivalent and nearly flat ABLs across frequencies as measured at the eardrum. D, Frequency-specific ABLs for each source in the three conditions (A-C). The 0 dB level is arbitrary.

