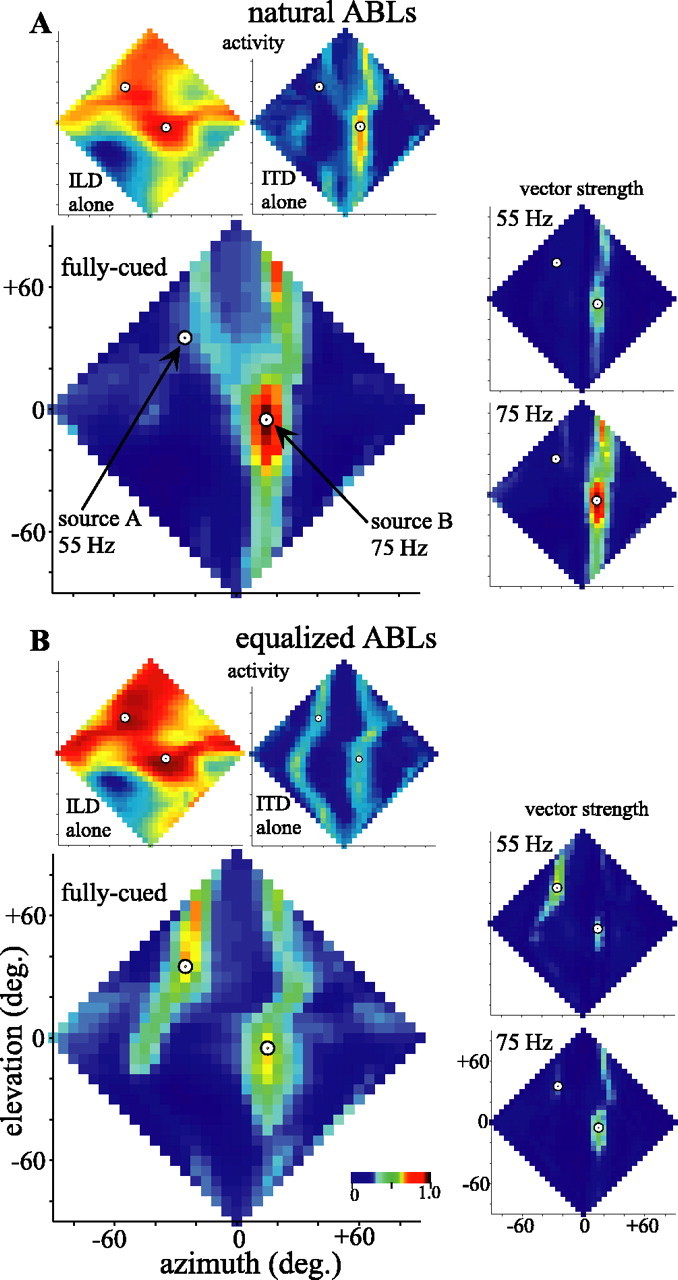
Figure 14.

Activity representing the frontal hemisphere of auditory space inferred from the model in response to two amplitude-modulated uncorrelated noises played from the locations indicated by circles in each plot (as in Figs. 11 and 12). The leftmost plots represent the normalized activity predicted across a combined bilateral-space map with homogenous RFs and spatial representation. Top, Smaller plots show ILD-alone (left) and ITD-alone (right) activity. Larger plots show the fully cued activity. All neurons are assumed to have identical Gaussian tuning curves centered on their best ITD and ILD values obtained from the HRTFs for their location in space. All frequencies (2-10 kHz) are weighted equally. Smaller plots at the right give the spatial distributions of vector strengths, indicating locking to the amplitude modulation of the stimulus at 55 Hz (top plots) or 75 Hz (bottom plots). The color scales are normalized to the range of values across all single-cued or all fully cued activity, or all vector strength plots, respectively. A, Activity and locking inferred when each source was presented with its natural, frequency-dependent ABL determined from its location in space. B, Activity and locking inferred when the two sources were presented with nearly identical ABLs at the eardrum (see Fig. 12 D).
