
Figure 3.
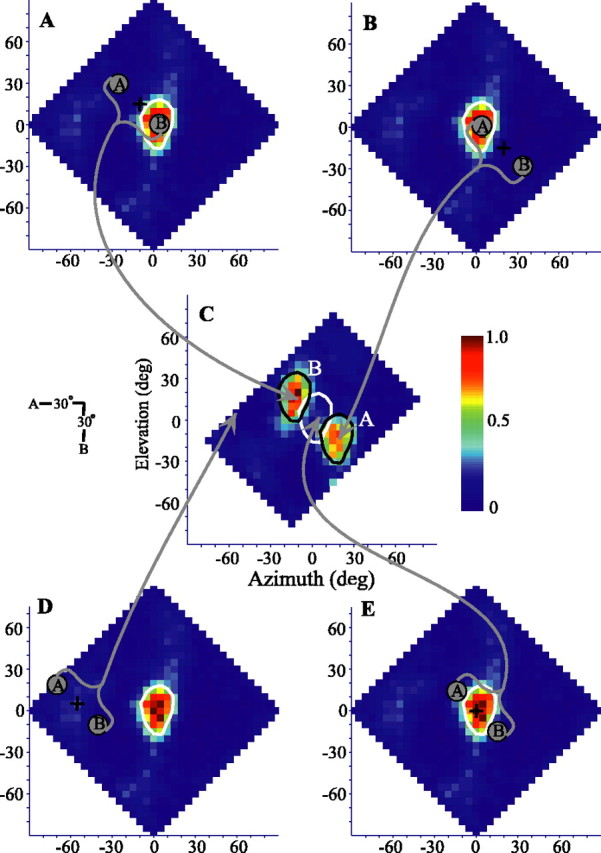
Construction of two-source spatial response profiles for a neuron recorded in the ICx. A, Normalized spike-rate responses to a single source are plotted as a function of azimuth and elevation. The 75° of maximum iso-rate contour is drawn in white. The same plot is repeated in B, D, and E. C, Responses for a two-source test with the sources separated by 30° in azimuth and 30° in elevation (inset). The one-source contour is replotted in white and again in black, shifted by the source offsets to show the expected areas of responses to two sources. Note that these areas, denoted by a white A and B, are in the reverse orientation from the sound sources A and B. To illustrate this, the two-source “array” is shown schematically for a particular array center location (marked by a plus symbol) in A, B, D, and E. In A, for example, with source B placed with in the RF and source A to the top left, the cell responded strongly. In the two-source spatial response profile (C), this response is mapped to a location corresponding to the array center, above and to the left of the one-source RF of the cell as indicated by the arrow. Data are interpolated from a 10° resolution checkerboard pattern. Cell 913EA is shown (see also Figs. 8 and 9). deg, Degree.