
Figure 4.
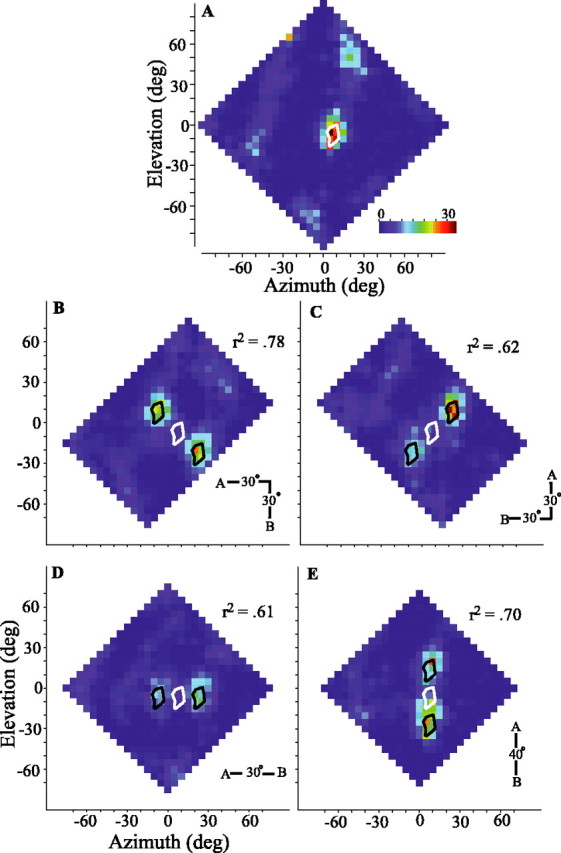
One- and two-source spatial response profiles of an ICx neuron. Two-source tests conducted for four spatial orientations (insets). A, Spike-rate responses to a single source plotted as a function of stimulus azimuth and elevation. The 75° of maximum iso-rate contour is shown in white. B-D, Responses to two sound sources offset by 30° in both azimuth and elevation (B, C), 30° in azimuth (D), or 40° in elevation (E). Data are as in Figure 3C, except that the actual spike rate (spikes per second) is presented with the same color scale for all plots. Values of r2 for each two-source plot indicate the maximum cross-correlation between the response of the cell and the response expected by appropriately shifting and averaging two copies of the single-source spatial response profile. Cell 913EF is shown. deg, Degree.