
Figure 5.
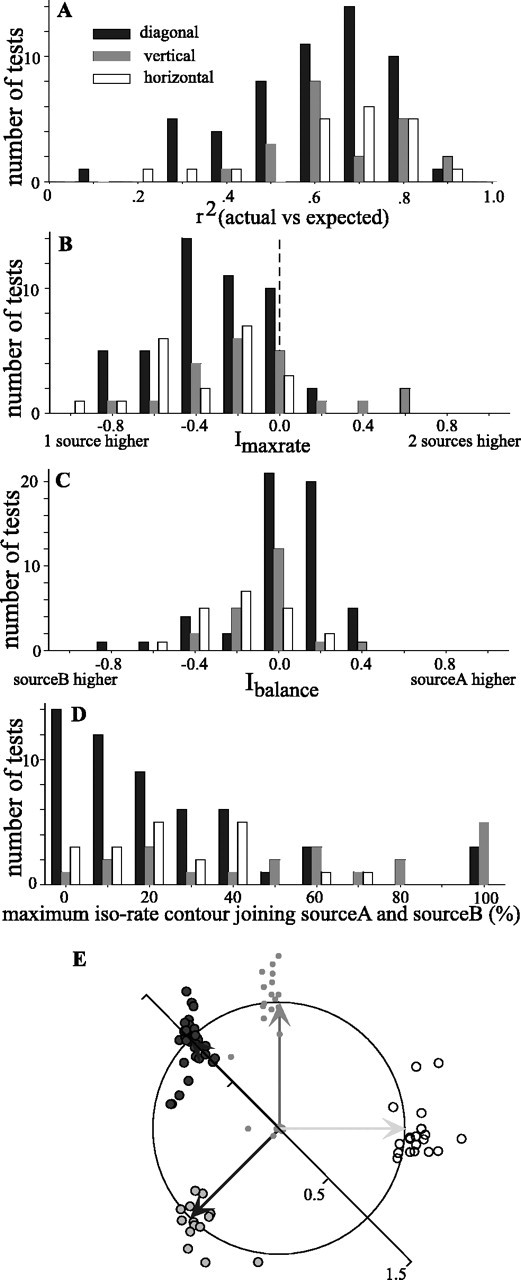
Summary of responses to two sound sources that were presented diagonally (filled), vertically (gray), or horizontally (open). A, Histograms of the r2 value obtained by cross-correlation of the two-source spatial response profile of the cell with one obtained by appropriately shifting and averaging two copies of the single-source spatial response profile. B, Histograms showing the distributions of Imaxrate, which compares the maximum firing rate in response to either of two sources versus that obtained in response to a single source. ndiag = 47 tests (43 cells); nhoriz = 21 (18 cells); nvert = 21 (21 cells). C, Distributions of Ibalance, which compares the maximum spike rates elicited by sources A and B. ndiag = 54 tests (46 cells); nhoriz = 21 (18 cells); nvert = 21 (21 cells). D, Distributions of the maximum normalized iso-rate contour at which the responses to sources A and B join. ndiag = 54 tests (46 cells); nhoriz = 21 (18 cells); nvert = 21 (21 cells) For all histograms, the abscissa shows the bin centers. E, Orientation and separation of responses to two sources. Each test is represented as the tip of an imaginary vector pointing from the origin of the unit circle. The direction of the vector indicates the angle made by the two response areas, and its magnitude indicates the distance between the two response areas normalized by the expected distance. The expected vectors for each of the four test orientations are shown as solid arrows projecting from the origin to the edge of the circle (horizontal, light gray vector, open circles; vertical, medium gray vector, gray circles; diagonal, dark gray vectors, filled circles).