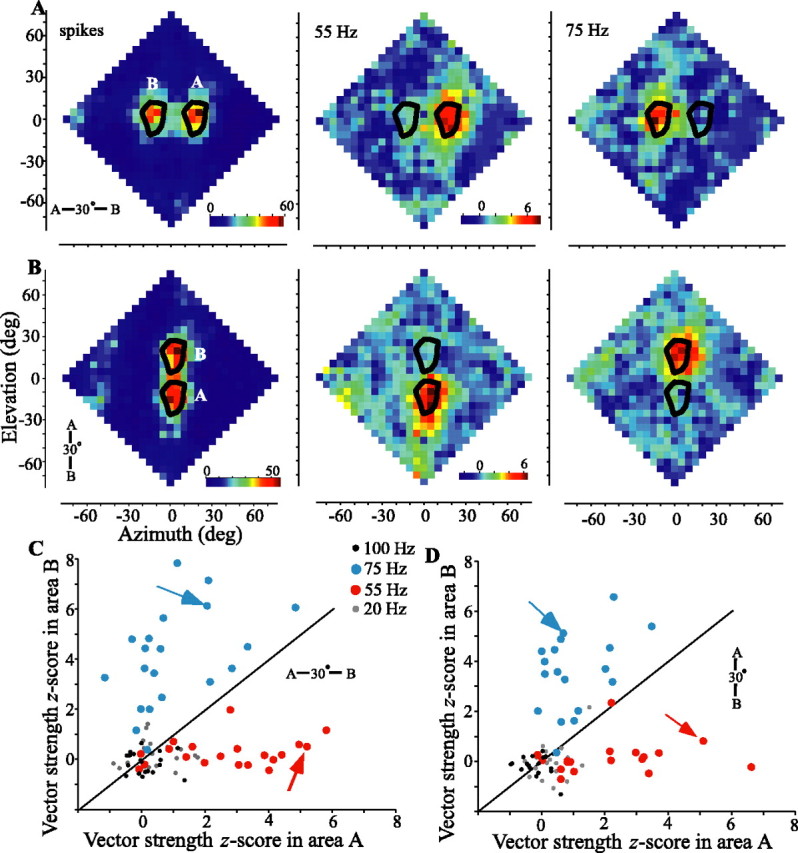
Figure 7.

Spatial response and z-score vector strength profiles for two sounds presented oriented horizontally (A, C) or vertically (B, D). The plotting conventions are the same as in Figure 6 A-D (cell 913EA, also shown in Figs. 3 and 6). The leftmost plot in A and B shows spike responses, and the middle and rightmost plots show z-score vector strengths for 55 and 75 Hz, respectively. For each of 20 cells (C) or 18 cells (D), the average z-score vector strengths are compared between the areas where responses to source A or source B are expected (gray, 20 Hz; red, 55 Hz; blue, 75 Hz; black, 100 Hz). The arrows indicate values for the cell shown in A and B. deg, Degree.
