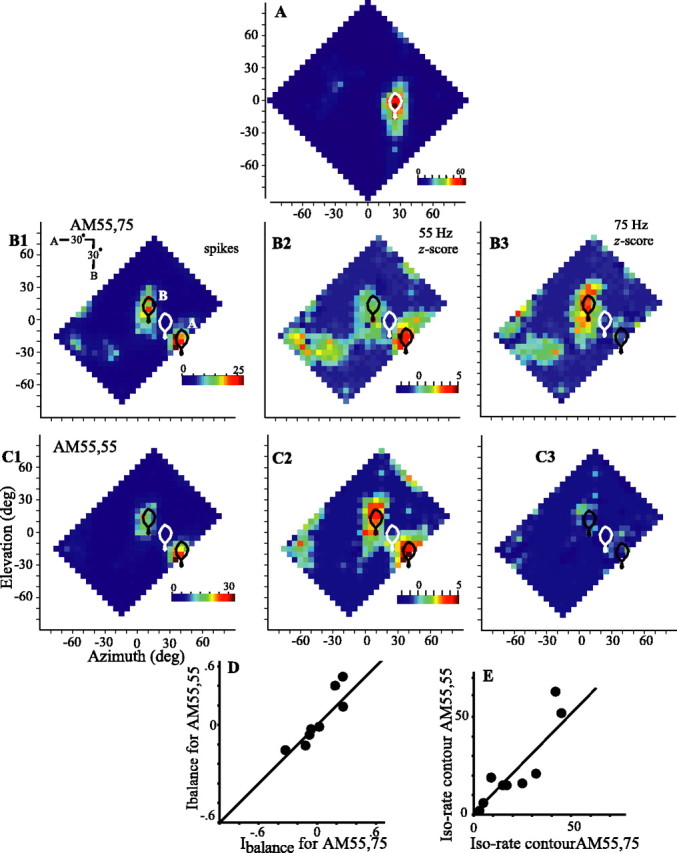
Figure 8.

The representation of two separate sources is not contingent on differential amplitude modulation. A, The single-source response with 75° of maximum iso-rate contour is plotted in white for one cell. B, C, Two-source spike responses (left) and 55 Hz (center) and 75 Hz (right) z-score vector strengths for two sounds oriented diagonally and amplitude modulated at 55 and 75 Hz (B) or 55 and 55 Hz (C) (cell 886DH). The responses of nine cells to tests using different (AM55,75) or identical (AM55,55) rates of amplitude modulation are compared for the Ibalance (D), which compares the maximum spike rates for each source, and for the depth of the saddle between response areas A and B (E), measured as the maximum iso-rate contour joining the response areas. Data are presented as in Figure 3C. deg, Degree.
