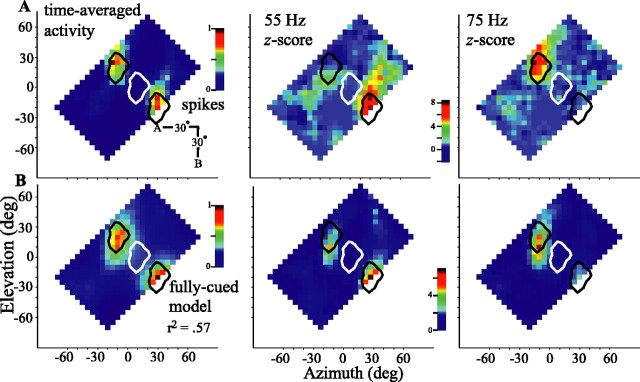
Figure 9.
Spatial response (left) and vector strength profiles (middle, 55 Hz; right, 75 Hz) of an ICx neuron and the associated model for stimulation by two sources presented in diagonal orientation (inset). A, Neuronal spatial response and vector strength profiles. B, Profiles of the fully cued model based on the single-source tuning of this cell to frequency-specific binaural cues. Data are presented as in Figure 3C. Cell 908BA is shown. deg, Degree.

