
Figure 7.
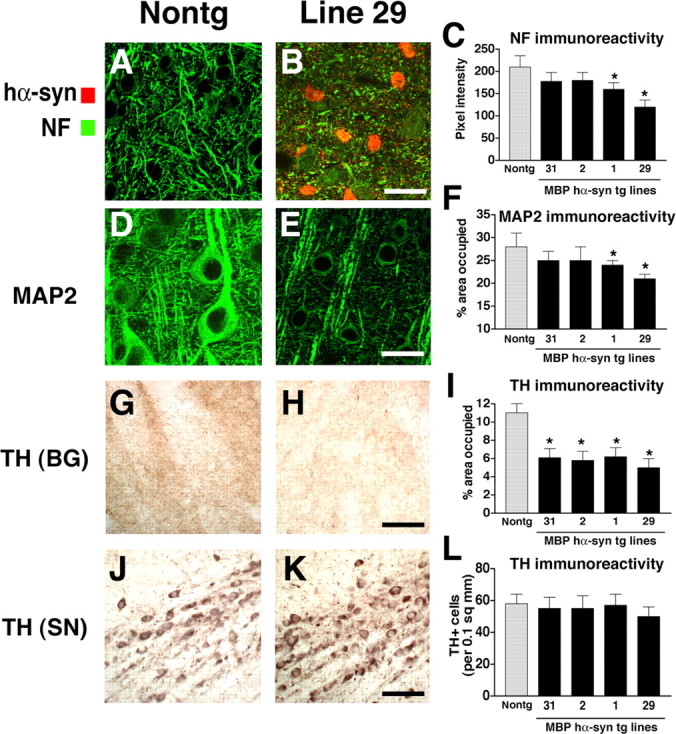
Patterns of neurodegeneration in the neocortex and dopaminergic system of MBP hα-syn tg mice. All panels are from the neocortex of 4-month-old mice. Sections were labeled with antibodies against hα-syn and NF or MAP2 and imaged with the LSCM or with an antibody against TH and imaged by bright-field microscopy. A, B, NF immunoreactivity demonstrates that compared with a nontg control (A), hα-syn immunoreactivity in oligodendrocytes (arrows) in the neocortex of tg mice (B) is accompanied by axonal atrophy and a decrease in the density of neuritic processes, particularly in the high-expresser line 29 (B). C, Levels of axonal integrity, as measured by NF immunoreactivity. Lines 2, 1, and 29 display more significant decreases in levels of NF immunoreactivity compared with nontg controls and low-expresser line 31. D-E, MAP2 immunoreactivity shows that compared with a nontg control (D), MBP hα-syn tg mice (E) had extensive damage to dendrites and decreased density of dendritic structures in the neocortex, particularly in the higher-expresser line 29 (E). F, Confocal analysis of the percentage of the area of the neuropil occupied by MAP2-immunoreactivite dendrites. High-expresser lines 1 and 29 demonstrate a significant decrease in MAP2 immunoreactivity compared with nontg controls and lower-expresser lines 31 and 2. G, H, Compared with a nontg control (G), MBP hα-syn tg mice (H) showed decreased TH-immunoreactive fibers in the basal ganglia (BG). I, Computer-aided image analysis of percentage of area occupied by TH-immunolabeled fibers. All tg lines demonstrate decreased levels of TH-immunoreactive fibers. J, K, TH immunoreactivity in neurons in the SN in nontg (J) and MBP hα-syn tg (K) mice. L, Image analysis of the numbers of TH-positive neurons shows no differences among the groups. sq, Square. Scale bars: (in B, E) A-E, 20 μm; (in H) G, H, 30 μm; (in K) J, K, 40 μm. Error bars are mean ± SEM. The asterisks indicate significant difference compared with nontg controls (p < 0.05; one-way ANOVA with post hoc Dunnett's).