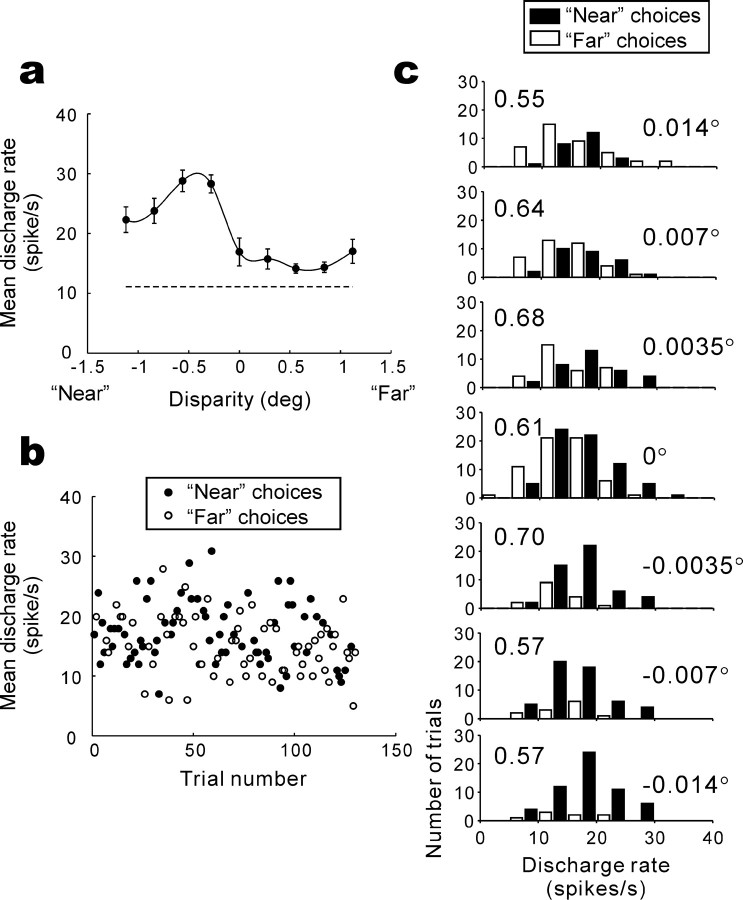
Figure 2.
Example disparity tuning and the relationship between neuronal responses and the monkey's choice. a, Discharge rate (mean ± SEM) of 10 presentations is plotted as a function of horizontal disparity. Data points are connected using a spline fit. deg, Degree. b, Trial-to-trial responses and the monkey's subsequent choices (•, near choice; ○, far choice) are plotted for zero-disparity trials. c, Response magnitude histograms for near (▪) and far (□) choice trials are superimposed for seven disparities (shown on the right). The choice probabilities calculated for each disparity (shown on the left) were 0.55-0.70.

