
Figure 3.
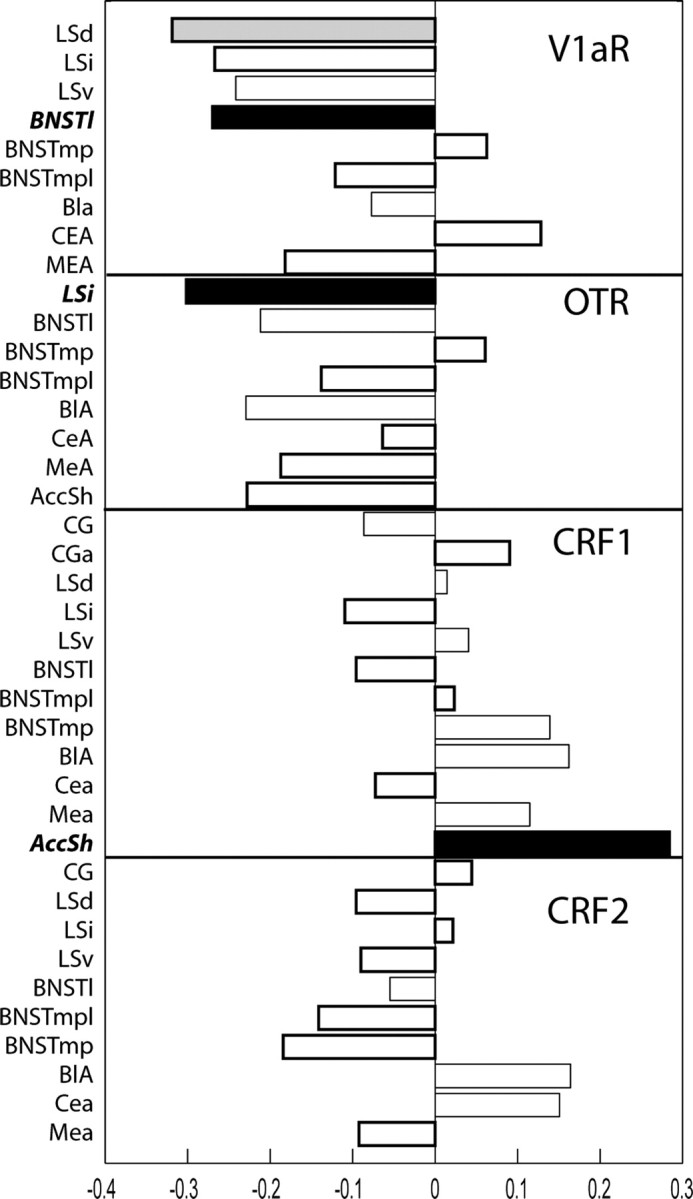
PLS analysis. PLS analysis revealed that V1a binding in the BNSTl, OTR in the LSI, and CRF1 in the AccSh demonstrated the strongest, most reliable covariation with IPS. These regions/receptors are indicated by the black bars and were subsequently used for the multiple regression analysis. V1a binding in the LSd (shown in gray) showed strong covariation with both IPS and preisolation baseline and was not used for the regression analysis. The bars indicate the magnitude and direction of the saliences or weights associated with the covariation of each brain regions with IPS. A negative salience indicates a negative correlation between IPS and binding and a positive salience indicates a positive correlation. The filled bars indicate significant saliences based on the bootstrapping reliability measure.