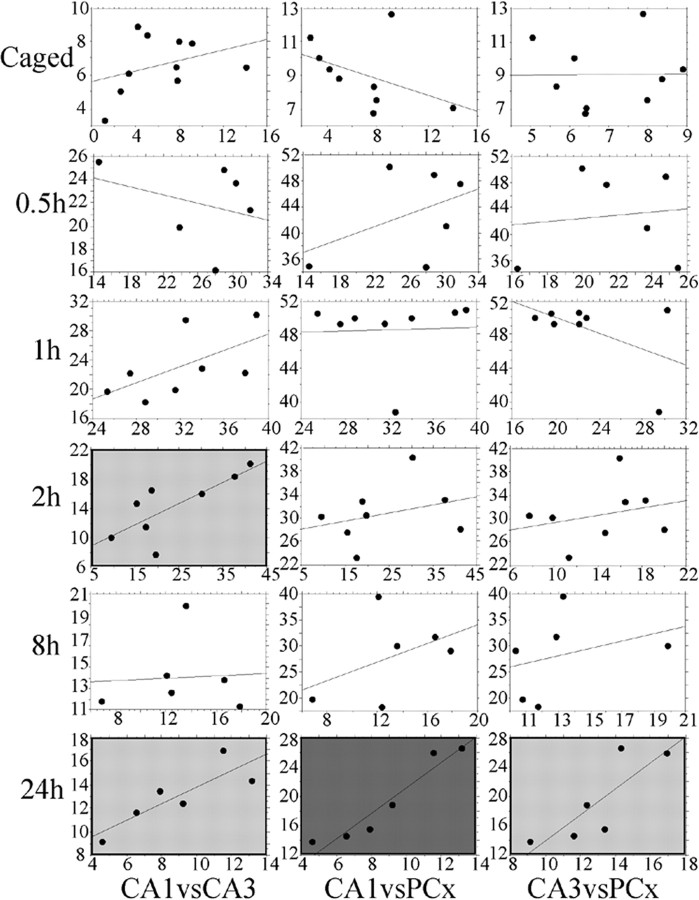
Figure 4.
Regression plots comparing the proportions of cells containing Arc protein over the three regions (CA1, CA3, and PCx) and four time points studied. Regression plots between CA1 (x-axis) and CA3 (y-axis) (left column), CA1 and PCx (middle column), and CA3 and PCx (right column) are shown. For simplicity, the time points shown here (other than for caged control) reflect the times at which the expression of Arc protein was statistically above control levels. There were no significant correlations at the 3, 4, and 6 h time points. The correlations in the plots with light gray background are significant at the p < 0.05 level, whereas the correlations in the plot with dark gray background are significant at the p < 0.01 level.

