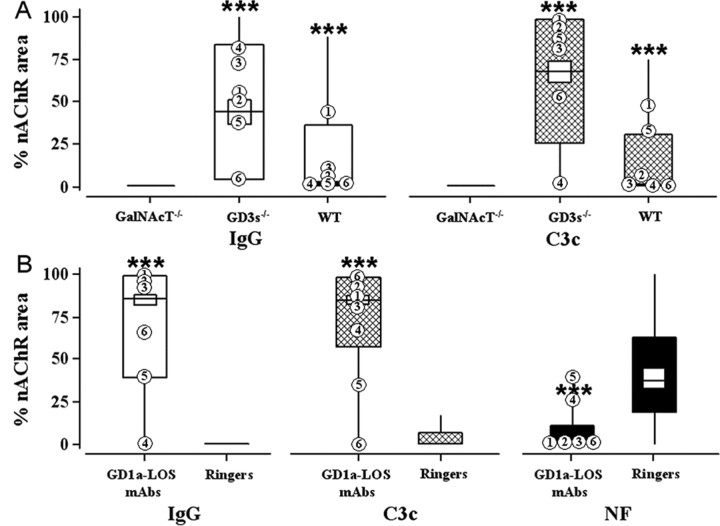
Figure 2.
Effects of anti-GD1a-LOS antibodies. Immunohistological analysis of anti-GD1a-LOS antibody binding, complement fixation, and destruction of NF is shown. A, Topical application to diaphragm. “% nAChR area” represents the area of the NMJ stained with TxR-BTx that is covered with fluorescent anti-IgG or anti-C3c signal. These values were calculated as described in Materials and Methods and expressed as the median (horizontal line), interquartile range (large box), and 1.5× the interquartile range (vertical line) of pooled data. IgG (white) or C3c (hatched) levels at NMJs in sections of WT, GD3s-/-, and GalNAcT-/- diaphragm are shown. Highest levels of IgG and C3c are seen in the GD3s-/- mouse. B, Ex vivo GD3s-/- hemidiaphragm preparations. IgG (white), C3c (hatched), and NF (black) levels at NMJs were calculated and expressed as in A. Ringer's solution or anti-GD1a-LOS antibody (100 μg/ml in Ringer's solution) was applied, followed by a source of complement. Anti-GD1a-LOS mAbs bind to the NMJ, fix complement, and cause an NF loss in the GD3s-/- mouse. ***p < 0.001 compared with Ringer's control solution. Median values of individual anti-GD1a-LOS mAbs are plotted as follows: 1, MOG-32; 2, MOG-34; 3, MOG-35; 4, TBG-1; 5, TBG-2; 6, TBG-3.

