
Figure 5.
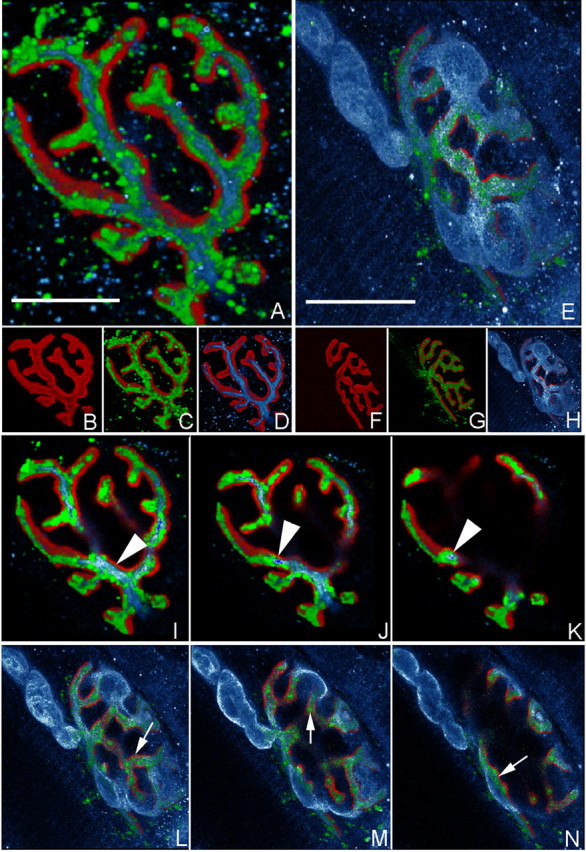
Localization of anti-GD1a-LOS mAb at the NMJ. Immunofluorescent localization of MOG-35 at GD3s-/- triangularis sterni NMJs is shown. Reconstructed confocal images of MOG-35-treated GD3s-/- preparations showing the localization of GD1a (MOG-35 staining), AChRs (TxR-BTx staining), neurofilament (anti-NF antibody staining), and perisynaptic Schwann cells (S100 staining). C, MOG-35 (green) was localized over gutters of the BTx (red) signal (B shows BTx alone). D, NF (blue) shows a similar localization over the BTx signal. A, A merged image of C and D indicated that the MOG-35 signal “wrapped” most of the NF signal. G, Another example of MOG-35 (green) localized over the BTx signal (red) (F shows BTx alone). H, The Schwann cell marker S100 (blue) labeled the pSC and terminal myelinating Schwann cell at this NMJ. E, A merged image of G and H indicated that the majority of MOG-35 staining was “underneath” the S100 signal, whereas the abaxonal pSC membrane was almost unstained.I-K, Serial sections through A. L-N, Serial sections through E. Arrowheads in I-K highlight MOG-35 staining that “wrapped” the NF signal. Arrows in L-N highlight MOG-35 staining that occurred essentially “underneath” the S100 staining. This is consistent with a primarily axonal localization, an adaxonal pSC membrane localization of MOG-35, or both. Scale bars, 10 μm.