
Figure 1.
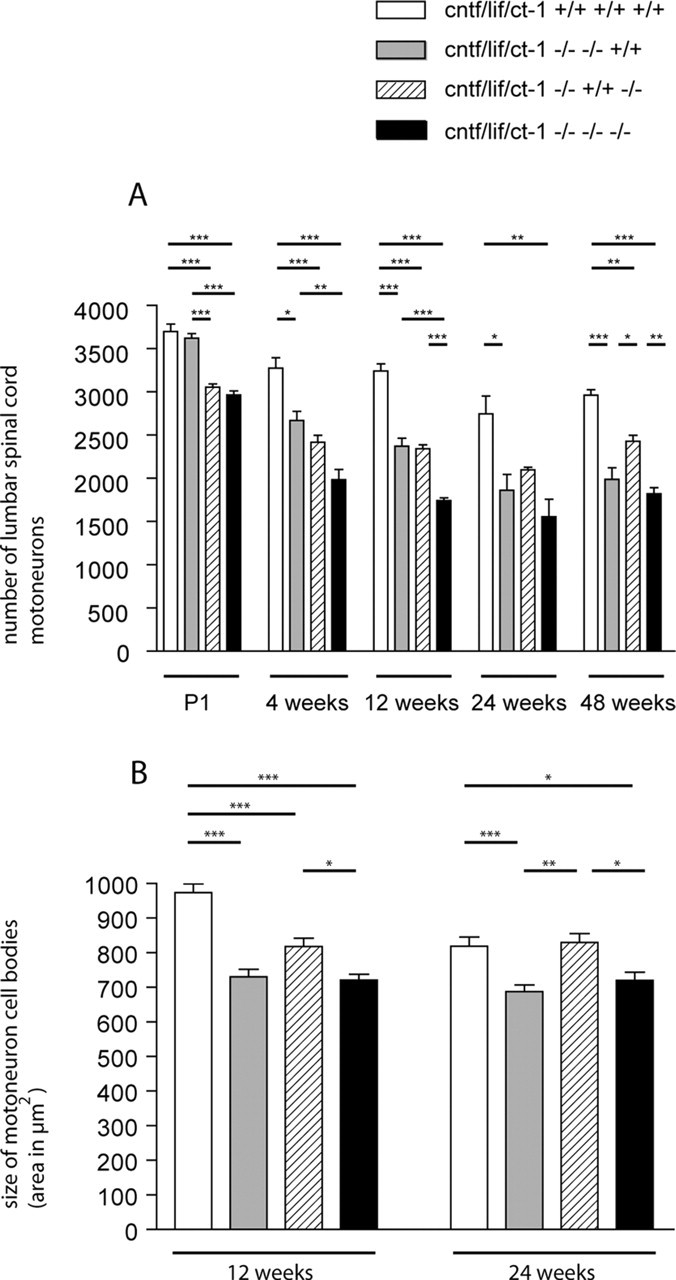
A, Motoneuron counts from lumbar spinal cord. Values shown are mean ± SEM corrected for split nuclei as described previously (Masu et al., 1993). B, Analysis of motoneuron cell body size. Total cell areas from motoneurons with typical Nissl structure and a clearly identifiable nucleolus were determined. The differences between the four groups of mice were tested by one-way ANOVA, followed by Bonferroni's post hoc comparison test. Comparison of individual groups gave the following results: *p < 0.05; **p < 0.01; ***p < 0.001. P1, Postnatal day 1.