Figure 8.

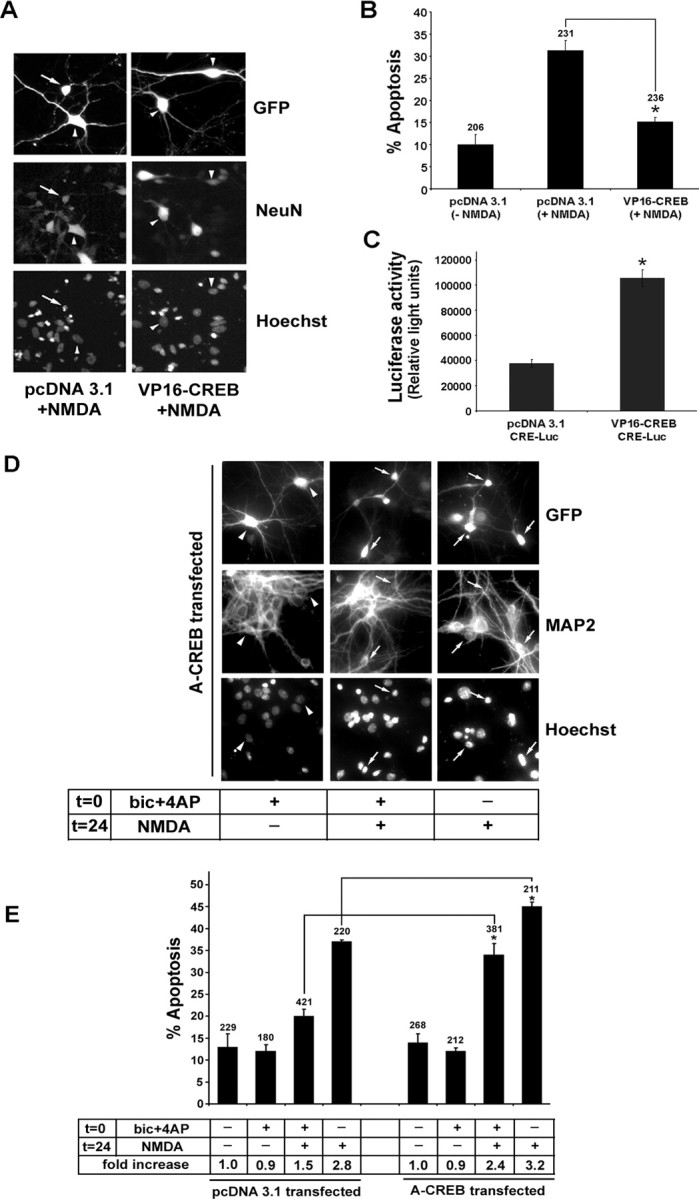
Synaptic activity attenuates NMDA-mediated cell death via a CREB-dependent mechanism. A, Neurons were transfected with VP16-CREB or the control vector pcDNA3.1 and stimulated 48 h later with NMDA (50 μm, 15 min). Cell viability was scored 8 h later. Cotransfection with GFP was used to identify transfected cells, NeuN was used to verify that the cells were neurons, and Hoechst labeling was used to assess toxicity. The arrow identifies a representative transfected cell that is dying; arrowheads denote healthy cells. B, Quantitation of the percentage of transfected neurons undergoing apoptosis. Relative to vector transfection, the transfection with VP16-CREB attenuated (*p < 0.05, significantly different from control vector transfection) the toxic effects of NMDA. Error bars denote SEM. Numbers above the bars indicate the number of neurons assayed. C, A CRE-luciferase reporter construct was cotransfected with VP16-CREB or pcDNA3.1 to validate that the constitutively active CREB construct stimulated CRE-dependent transcription (*p < 0.05, significantly different from control vector transfection). D, A-CREB attenuates the neuroprotective effects of synaptic activity. Neurons were cotransfected with GFP and A-CREB expression vectors. Then 24 h later, neuronal activity was elicited [t = 0, bicuculline (bic) plus 4-AP with nimodipine and CNQX, 15 min]. NMDA (50 μm) was administered 24 h after bicuculline stimulation (t = 24, 15 min), and cell viability was scored 8 h later. GFP immunofluorescence was used to identify transfected cells, MAP2 was used to verify that the cells were neurons, and Hoechst labeling was used to assess toxicity. Arrows identify transfected cells that were dead or dying; arrowheads denote healthy cells. E, Quantitation of transfected neurons undergoing apoptosis. Relative to control expression vector transfection (pcDNA3.1), transfection with A-CREB significantly attenuated (*p < 0.05, relative to control vector transfection) the neuroprotective effects of synaptic activity and augmented the neurotoxic effects of NMDA. Numbers above each bar indicate the number of neurons assayed. In the table shown below the bars, the percentage of apoptotic neurons was normalized to control conditions (no stimulation), which was set equal to 1. Error bars denote SEM. Data are the mean of triplicate determinations.
