
Figure 5.
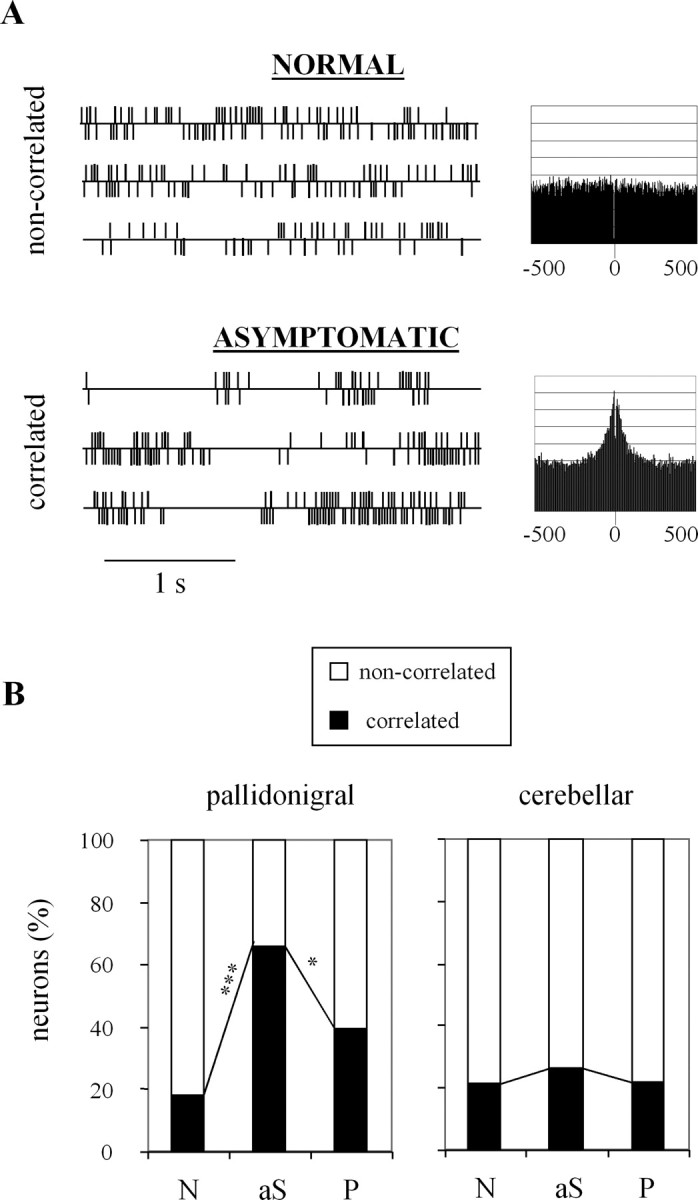
Evolution of cross-correlations with MPTP intoxication. A, Examples of spike trains and cross-correlograms for noncorrelated and correlated pairs recorded in the normal and asymptomatic states. The two recordings were made in the pallidonigral thalamus of the same monkey. The two unit activities are displayed above and below the horizontal line. For the cross-correlograms, the y-axis is in arbitrary units and the x-axis is in milliseconds. B, Distribution of correlated and noncorrelated pairs. A χ2 test was performed to compare the percentage of correlated pairs between two successive clinical states. *p < 0.05; ***p < 0.001. N, Normal; aS, asymptomatic; P, parkinsonian. The data of the three monkeys were pooled.