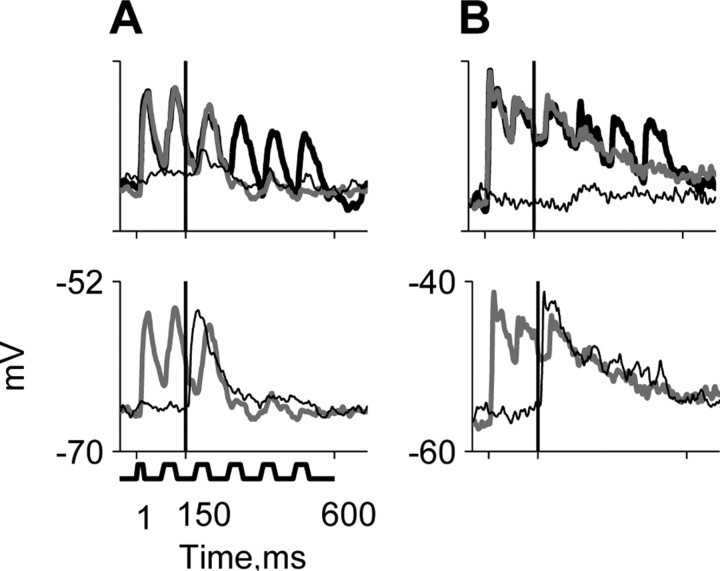
Figure 6.
Responses to near-threshold tones in noise are similar to the responses to suprathreshold tones in silence. A, B, Responses of two neurons. B is the same neuron as in Figure 5A. The top panels depict the responses to noise alone (thick black line), to a noise plus tone combination at the minimal tone level tested (gray line), and to the same tone level when presented alone (thin black line). The bottom panels depict the responses to a tone plus noise at the minimal tone level tested (gray, same as in top panel) and the response to a suprathreshold level that saturated the tone response (thin black line). Parameters [BF (kHz): low-tone level, and high-tone level in SNR, low-tone level and high-tone level in dB SPL]: A, 29, 3, 41, 73; B, 15, -57, -25, 36, 68.

