
Figure 7.
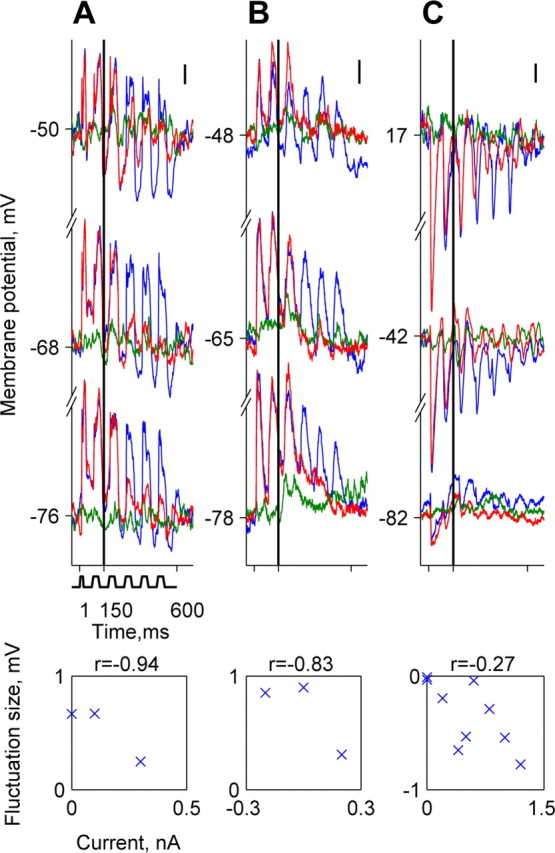
Membrane potential responses of A1 neurons during current injection. A-C, Responses of three neurons. B is the same neuron as in Figure 5A. Each panel depicts the responses to a low-level tone plus noise combination (red), the responses to tone alone at the same level (green), and responses to noise alone (blue). These are shown at three current injection levels. The scatter plots show the mean fluctuation size as a function of current level for all current levels used to test each of the three neurons. The correlation coefficient r is displayed above the scatter plot. A, Currents (nA; from bottom to top): 0, 0.1, 0.3; BF, 20 kHz; SNR, -32 dB. B, Currents (nA; from bottom to top): -0.2, 0, 0.2; BF, 17 kHz; SNR, -23 dB. C, Currents (nA; from bottom to top): 0, 0.6, 1.2; BF, 3 kHz; SNR, -32 dB. Scale bars, 2 mV.