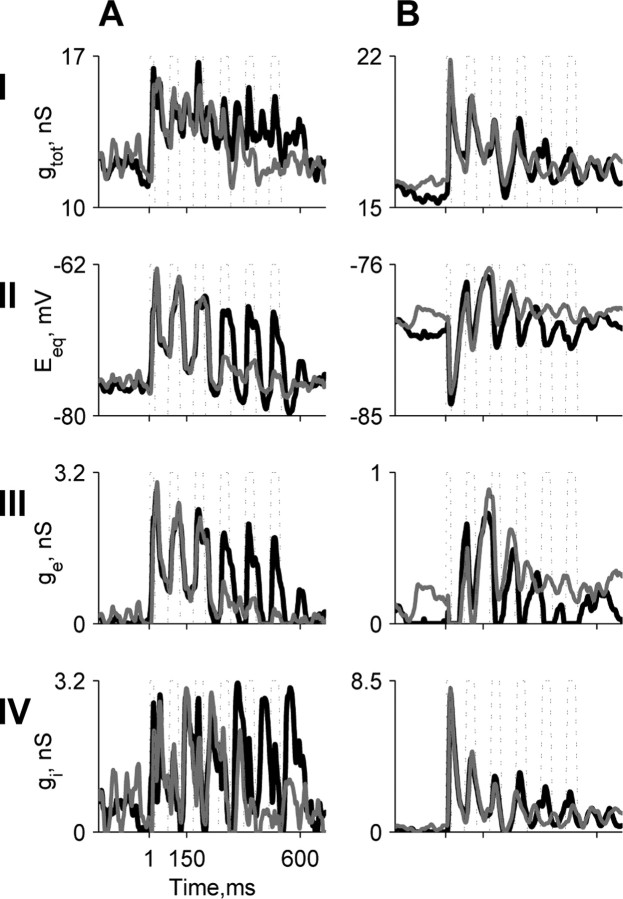
Figure 8.
Suppression of the locking of the excitatory and inhibitory conductances to the noise envelope by low-level tones in A1 neurons. A is the same neuron as in Figure 7A, and B is the same neuron as in Figure 7C. Each panel shows the changes during noise alone (black) and noise plus tone representation (gray). Row I, Total conductance, gtot. Row II, Equivalent reversal potential, Eeq. Row III, Excitatory conductance, ge. Row IV, Inhibitory conductance, gi.

