
Figure 1.
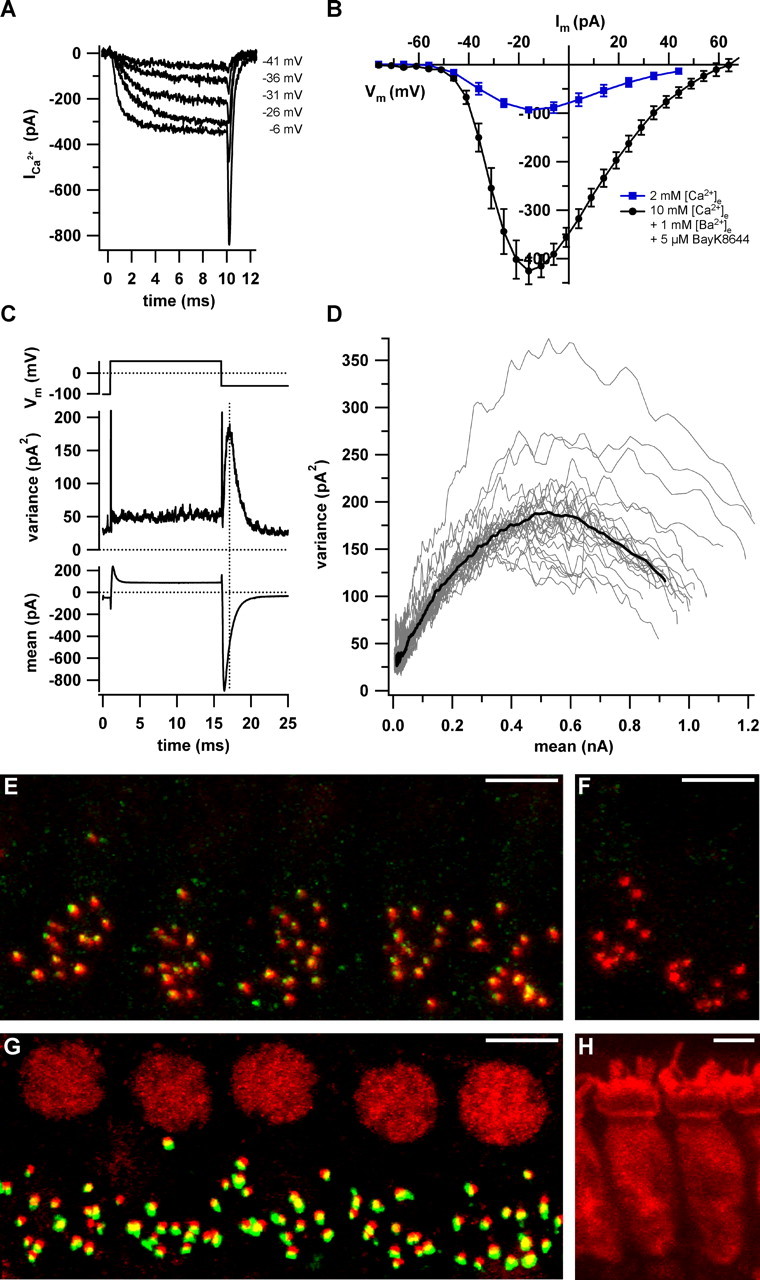
Counting Ca2+ channels and ribbon synapses in apical IHCs. A, Example Ca2+ currents evoked by 10 ms step depolarizations from –86 mV to the specified levels in the presence of 5μm BayK8644, 10 mm Ca2+, and 1 mm Ba2+. B, Average steady-state IV relationships in augmenting conditions (black circles; solutions as in A) and at close to physiological [Ca2+]e (2 mm; blue squares). C, Voltage-clamp protocol (top), variance (middle), and mean (bottom) calculated from a P/n-corrected ensemble of 500 sweeps (interval, 80 ms). D, Variance versus mean parabolas obtained from 27 ensembles of nine cells (gray traces) and the grand average calculated from parabolas of the individual cells (black trace). E, A typical 3D reconstruction of a wild-type organ of Corti after staining for CaV1.3 (green) and RIBEYE/CtBP2 (red). F, Identical processing of an organ of Corti from a CaV1.3 knock-out mouse. G, A typical double staining for RIBEYE/CtBP2 (red) and GluR2/3 glutamate receptors (green). Juxtaposed spots of red and green fluorescence represent intact ribbon synapses. IHCs were counted by means of their nuclear CtBP2 signal. H, The cytosolic staining using an antibody to calbindin (red). Scale bars, 5 μm.