Figure 3.
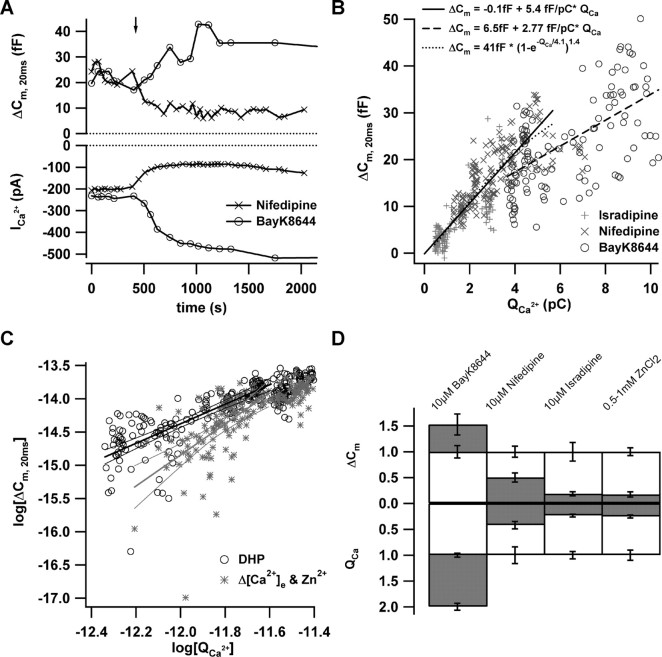
Effects of primary changes in open Ca2+ channel number. A, The time course of exocytic ΔCm, 20 ms (top) and QCa (bottom) in response to repetitive depolarization (20 ms; to the peak Ca2+ current potential; 10 mm [Ca2+]e). In these representative perforated-patch experiments, nifedipine (10μm; ×) or BayK8644 (10μm; ○) were applied by slow bath perfusion as indicated by the arrow. B, ΔCm, 20 ms and QCa for a total of 15 such experiments (10μm isradipine, +; 10 μm nifedipine, ×; and 5 μm BayK8644, ○; n = 5 for each condition). DHP were washed in after achieving a control steady state as illustrated in A. The lines correspond to the fit functions provided in the graph. Solid and dotted lines, Line and power of exponent fits to the data acquired with inhibitory DHP (the fit interval from lowest integral up to 5 pC was chosen as in Fig. 2 for better comparison); dashed line, line fit to BayK8644 data. C, The logarithms of exocytic ΔCm, 20 ms (in farads) and QCa (in coulombs) for both manipulations (DHP, black circles; Zn2+ and Δ[Ca2+]e, gray asterisks). The lines represent line fits to both data sets (along with 99% confidence intervals) yielding Ca2+ cooperativities of 1.4 and 2.3 for DHP and Zn2+/Δ[Ca2+]e, respectively. D, Steady-state effects of 10 μm BayK8644, 10 μm nifedipine, 10 μm isradipine, or 0.5–1 mm Zn2+ (n = 5 for each condition) on ΔCm, 20 ms (top) and QCa (bottom). The gray filling indicates the average ΔCm, 20 ms and QCa estimates after drug application after normalization to the grand averages obtained before drug. Error bars represent SEM. QCa, Ca2+ current integrals.

