
Figure 5.
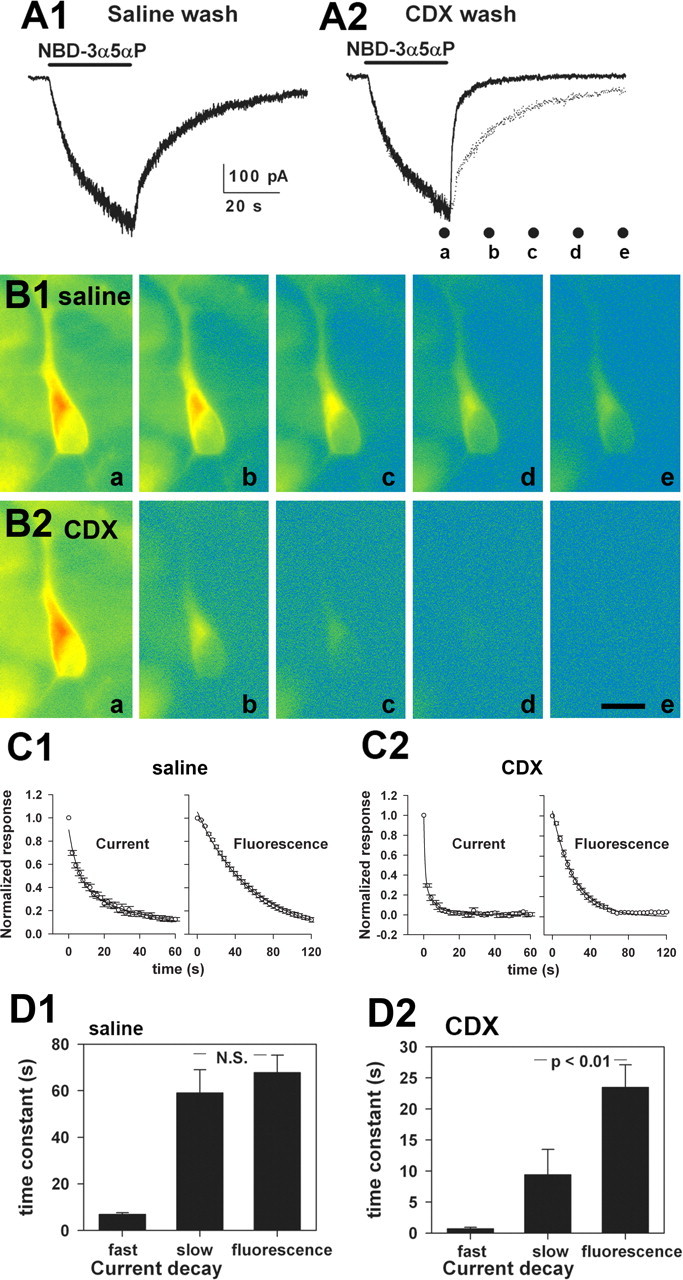
The bulk intracellular steroid pool equilibrates with the receptor-accessible pool in <1 min. A1, Directly gated current in a hippocampal neuron by 3 μm NBD-3α5αP. After 30 s of application, the cell was washed with saline. A2, The same neuron was rechallenged, but the wash included 500 μm γ-cyclodextrin (CDX). The dotted trace is a replot of A1 for comparison. The dots below the trace indicate time points at which images were taken of cells for B. B1, Pseudocolor fluorescence images (warm colors, high-fluorescence intensity; cool colors, low-fluorescence intensity) of a cell subjected to the protocol in A1. Photographs were from the time points indicated by the labeled dots in A2 (a– e). B2, The same cell was subjected to the protocol indicated in A2. Again, the photographs are from the time points indicated by the dots in A2. Scale bar, 20 μm. C1, C2, The data points show raw normalized decays of NBD-3α5αP-gated currents (left graphs; n = 8 saline-washed and 7 CDX-washed neurons) and fluorescence (right graphs; n = 8 saline-washed and 6 CDX-washed neurons). For current traces, only every 100th data point is represented for clarity. The lines represent superimposed biexponential fits (current decays) and single-exponential fits (fluorescence). Parameters are summarized in D. D1, D2, Summary of exponential fits to the decay phase of NBD-3α5αP-generated currents and decay of intracellular fluorescence from the individual cells represented in C. Current decays were well described by a biexponential fit in all cases. The fast component accounted for 57 ± 5% of the decay in saline and 59 ± 5% in γ-cyclodextrin. Fluorescence decays were fit to fluorescence intensities taken from an intracellular region near the nucleus. To diminish bleaching, images were obtained beginning at the end of the 30 s application of NBD-3α5αP, continuing every 4 s for 60–120 s. Fluorescence decays were well described by a single exponential. Both the fast and slow time constants of current decay were significantly speeded by cyclodextrin wash, as was the time constant of fluorescence wash(p<0.01; note the change in the y-axis between D1 and D2). Data show mean ± SEM from seven to eight cells.