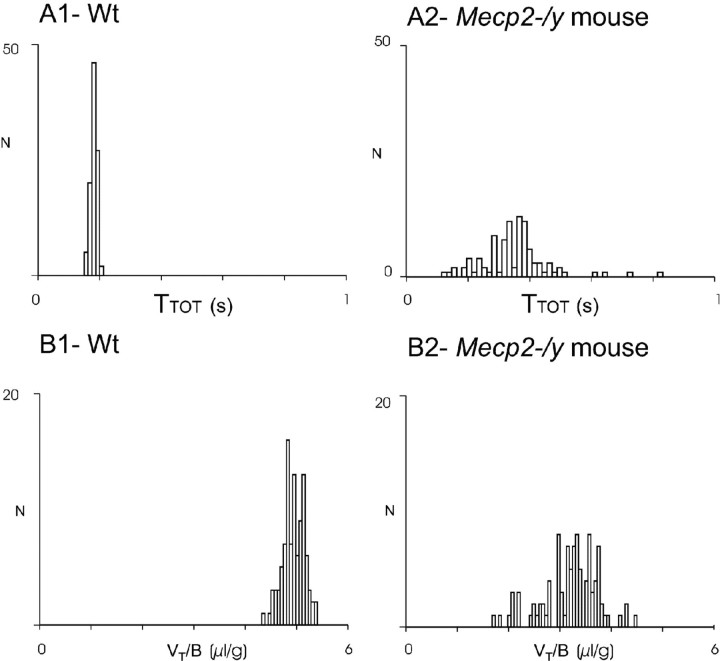
Figure 3.
Comparison of breathing parameters in wt and Mecp2-/y adult mice. Distribution of TTOT and VT /B values recorded in unanesthetized paired wt and Mecp2-/y mice from the same litter (recording performed the same day). Frequency histograms represent the number of occurrences (ordinate) of TTOT (A1, A2, abscissa) and VT/B (B1, B2, abscissa) values on 100 consecutive respiratory cycles during quiet breathing in the wt mouse (A1, B1) and the Mecp2-/y mouse (A2, B2) from one pair of littermates.

