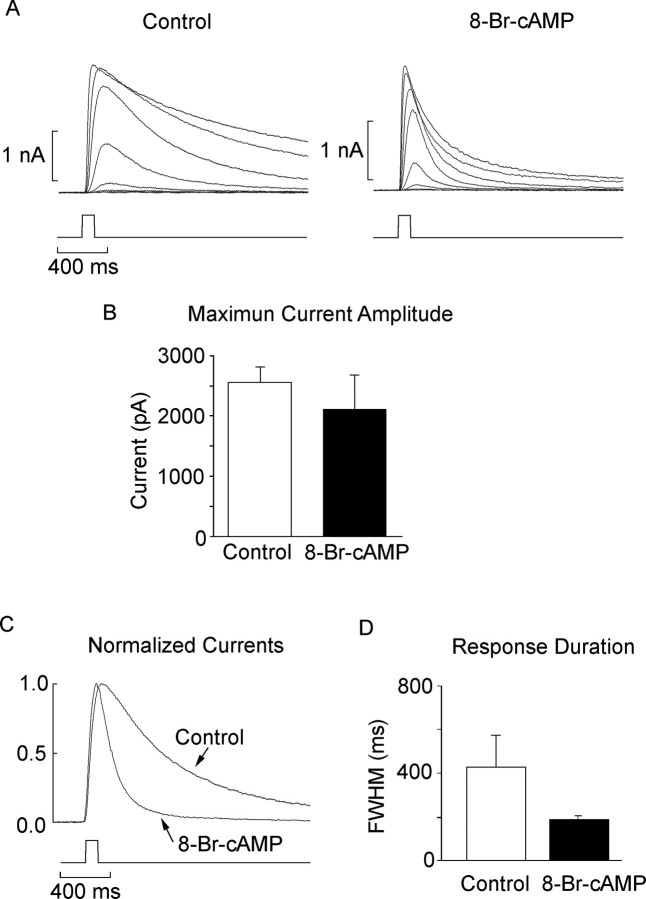
Figure 7.
Modulation of response kinetics by cAMP analogs. A, Representative intensity series obtained in one voltage-clamped control cell (left) and one dialyzed with 50 μm 8-Br-cAMP (right). Test flashes were 100 ms in duration, and the holding potential was -30 mV. B, Mean amplitude of the saturating photocurrent for control and 8-Br-cAMP-treated cells; the difference was not statistically significant. Error bars indicate SD. C, Normalized, superimposed traces of photocurrents elicited by flashes of identical, subsaturating intensity. The time course of the response obtained in the presence of 8-Br-cAMP is markedly accelerated. D, Bar graph representing the average width of the flash response at half-maximal amplitude (n = 8 and 9 for control and 8-Br-cAMP-treated cells, respectively).

