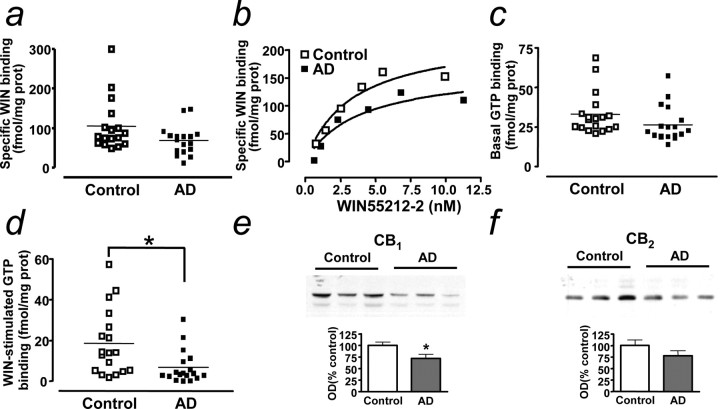
Figure 3.
CB1 receptor binding is unaltered and G-protein coupling is reduced in AD frontal cortex. a, Specific 3H-WIN55,212-2 (WIN) binding (n = 18 in each group). b, Representative 3H-WIN55212-2 binding saturation curves (n = 3 in each group). c, Basal 35S-GTPγS binding (n = 18 in each group). d, WIN55,212-2-stimulated 35S-GTPγS binding (n = 18; *p < 0.05 compared with controls; Student's t test). e, f, CB1 (e) and CB2 (f) expression (as detected by Western blot) in control and AD brain. OD, Optical density. Results are mean ± SEM of n = 18 in each group; *p < 0.05 compared with controls (Student's t test); representative blots are shown. Error bars represent SEM.

