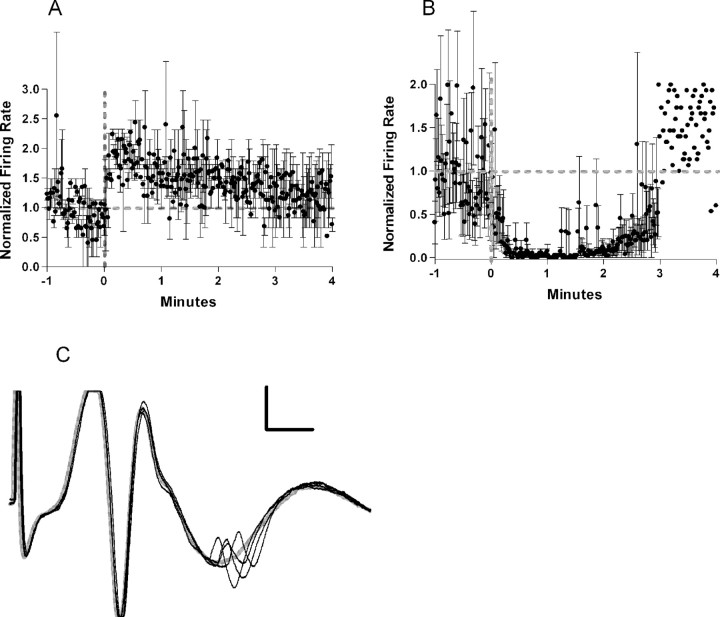
Figure 4.
A, Normalized firing rate of the three feedback cells excited by locus ceruleus activation. The averaged firing rate doubles almost immediately after ejection and returns to baseline by 3 min. Thick gray dotted lines indicate the baseline firing rate and time of ejection. Thin black lines indicate SE. B, Normalized firing rate of two of the four feedback cells inhibited by locus ceruleus activation. The two cells that were omitted had baseline firing rates of <1 Hz. The averaged firing rate drops to 0 and then shows recovery of firing between 2 and 3 min. C, Example of a feedback cell. The cell would discharge only at currents sufficient to evoke a robust population spike. A failure is shown in gray. Calibration: 100 μV, 2 ms.

