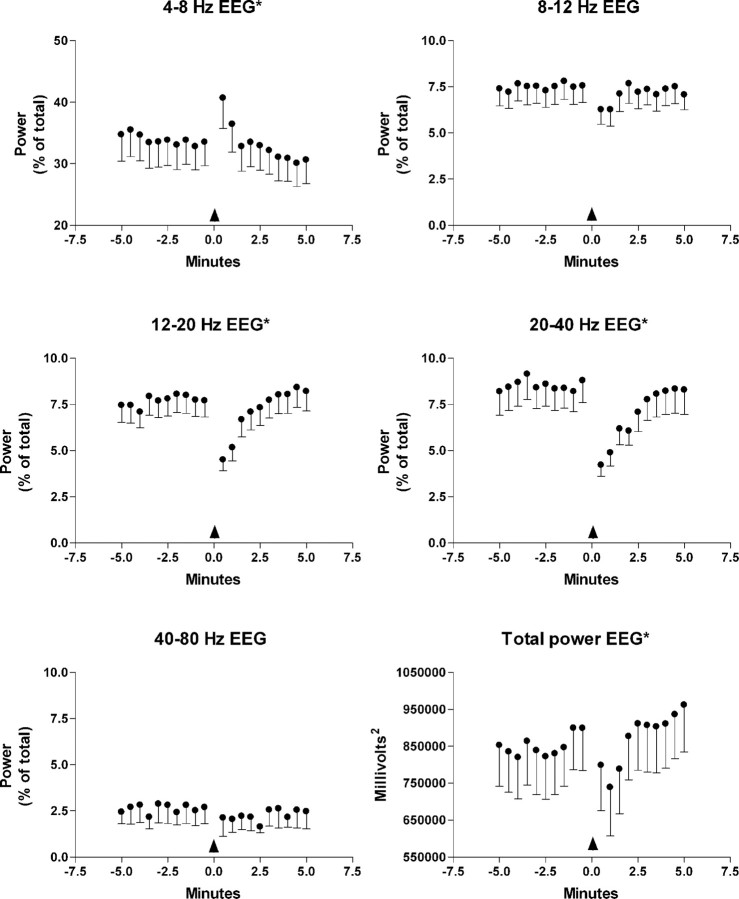
Figure 8.
Relative EEG power expressed as a percentage of total in the indicated frequency ranges for 5 min before and after locus ceruleus activation by glutamate ejection (n=18) in the locus ceruleus. The arrow indicates glutamate ejection. The bottom right-hand graph shows the variation in total power. Error bars indicate SE of the mean. *p < 0.05; variation over time was significant in a repeated-measures ANOVA.

