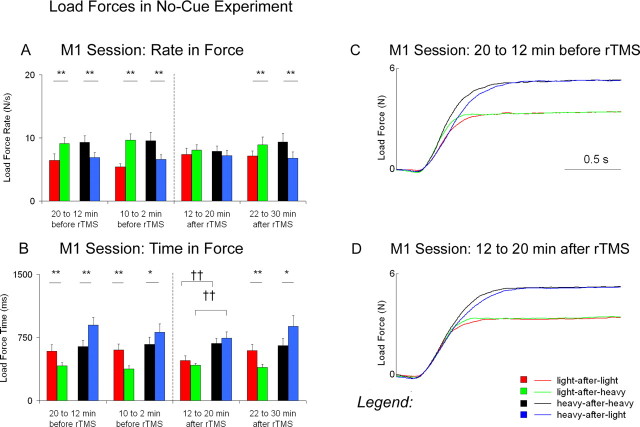
Figure 4.
Load forces in the no-cue experiment. A represents means ± SEM for the rates in load force before and after repetitive stimulation over the primary motor cortex (M1). B represents means ± SEM for the load-force times before and after repetitive stimulation over M1. C represents the overall average traces for load forces 20-12 min before repetitive stimulation over M1. D represents the overall average traces for load forces 12-20 min after repetitive stimulation over M1. Asterisks denote significant differences between switch conditions (*p ≤ 0.05; **p < 0.01). Daggers denote significant differences between weight conditions at post-1 (††p < 0.01).

