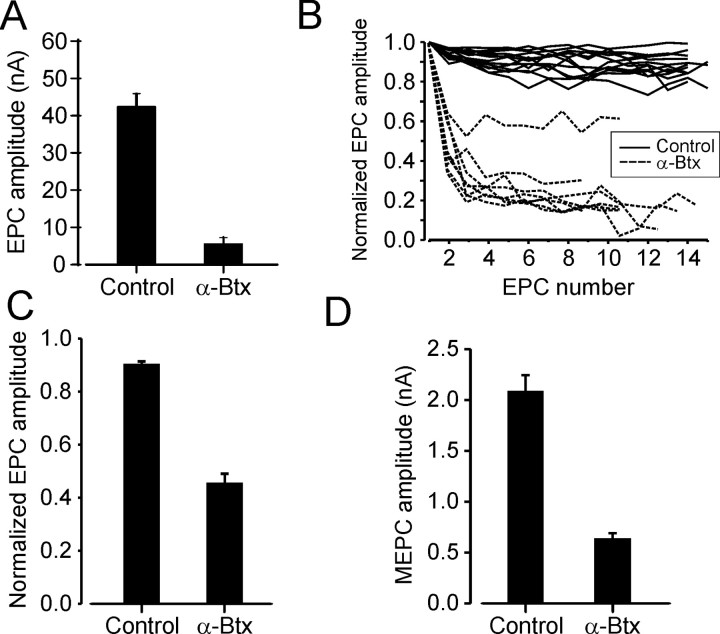
Figure 4.
Effects of α-btx on neuromuscular transmission at MG muscle NMJs. A, Vertical bars show the mean ± SEM of mean EPC amplitudes (holding potential, -50 mV) obtained from individual control experiments (n = 3) and from MG muscle fibers studied 24 h after two daily α-btx injections (n = 2). Each mean includes data from at least eight fibers. B, Comparison of EPC amplitude depression at a stimulus rate of 1/s between EPCs obtained from one control experiment and from one experiment 24 h after two daily α-btx injections. Each line represents data from one muscle fiber. EPC amplitudes are normalized to the amplitude of the first EPC in the sequence. C, Vertical bars show the mean ± SEM of mean amplitudes of the fifth EPC normalized to the first EPC amplitude in sequences obtained at 1/s as in B. Data obtained from MG muscles of two control animals and from MG muscles of two animals 24 h after two daily α-btx injections. D, Vertical bars show the mean ± SEM of mean MEPC amplitudes studied at a holding potential of -120 mV and obtained from a single control experiment and from MG muscles studied 48 h after four daily α-btx injections (n = 2).

