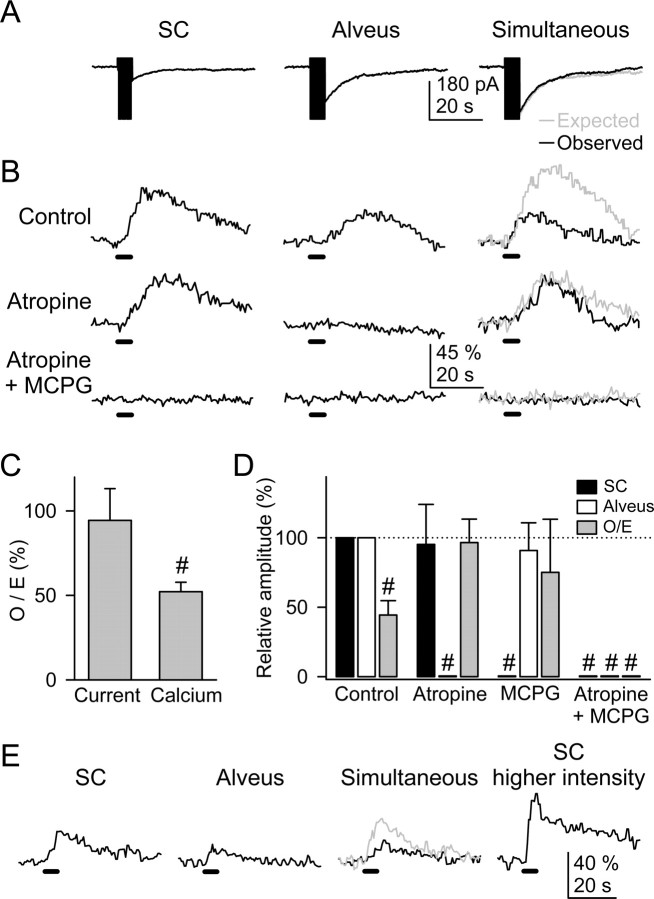
Figure 2.
The astrocyte Ca2+ signal was modulated by the simultaneous activity of alveus and SC synaptic terminals. A, Representative whole-cell currents elicited by independent or simultaneous stimulation of the SC and alveus (30 Hz, 5 s). In a simultaneous stimulation condition, black and gray traces correspond to the observed and expected responses (i.e., the summation of responses evoked by independent stimulation of both pathways), respectively, as in all other figures. B, Astrocyte Ca2+ levels evoked by independent or simultaneous stimulation of the SC and alveus in control conditions, in the presence of 50 μm atropine, and after the addition of 0.8 mm MCPG. Horizontal lines at the bottom of each trace represent the stimuli, as in all other figures. C, Ratio between observed and expected responses. D, Relative amplitude of the astrocytic Ca2+ elevations evoked by independent or simultaneous stimulation of the SC and alveus in controls and in the presence of 50 μm atropine and 0.8 mm MCPG. The responses evoked by simultaneous stimulation were quantified from the O/E ratio (i.e., the ratio between the observed response evoked by simultaneous stimulation and the expected response: the summation of the responses evoked by independent stimulation) (see Results). n ≥ 5 for each bar. E, Representative example of Ca2+ elevations evoked by the SC, alveus, simultaneous stimulation at a constant intensity, and after increasing the SC stimulation intensity. Note that the Ca2+ elevation elicited by SC stimulation at a stronger intensity was higher than the expected Ca2+ increase under simultaneous stimulation (gray trace). Significant differences were established by the Student's t test at #p < 0.001.

