
Figure 2.
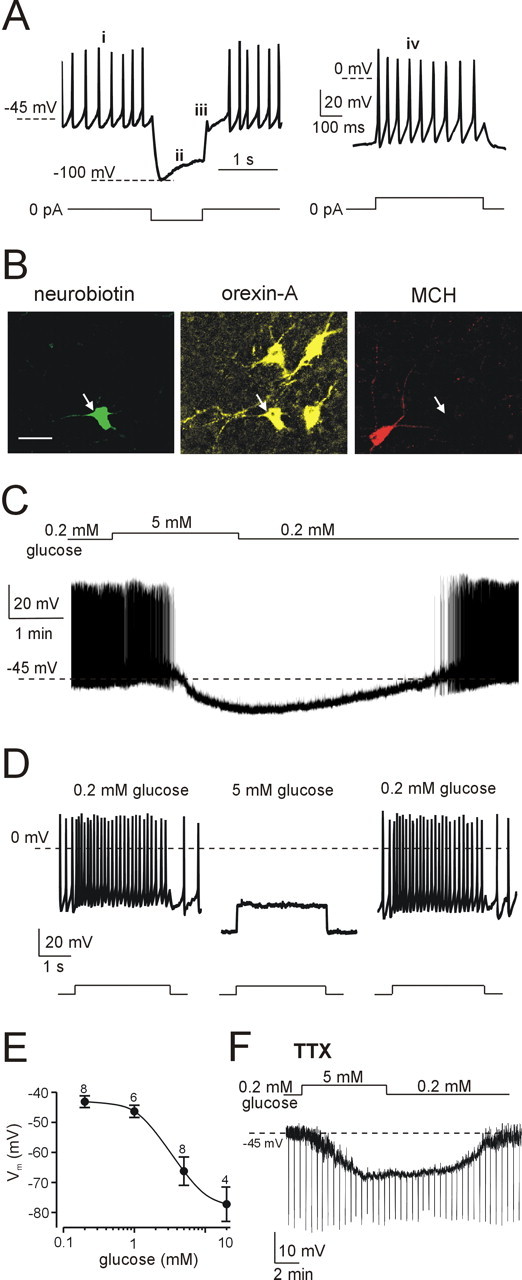
Electrical responses of LH orexin neurons to physiological changes in glucose. A, Defining electrical signature of orexin neurons: tonic spontaneous firing (i), H-current-mediated sag (ii), low-threshold spike (iii), and little spike-rate adaptation (iv). Current-clamp protocols used to elicit these responses are shown schematically below corresponding traces. B, Immunofluorescence imaging of the cell shown in A, identified by Neurobiotin staining (green); the cell contains orexin-A (yellow) but not MCH (red). Scale bar, 20 μm. C, Glucose induced reversible hyperpolarization and inhibited spiking in an orexin neuron. D, Glucose suppressed the spiking response to depolarizing current injection (40 pA for 3 s; protocol shown schematically below the traces); this effect was reversible after glucose washout. E, Dose-response relationship of glucose-induced hyperpolarization of orexin cells (IC50 = 3.5 mm; h = 1.8; Vmax = -78.8 mV; V0 = -42.9 mV; the general equation of the fit is given in Materials and Methods). Numbers of cells are indicated above corresponding points. F, In the presence of tetrodotoxin (TTX) (300 nm), glucose induced hyperpolarization and decreased membrane resistance (resistance was monitored as described in Fig. 1F).