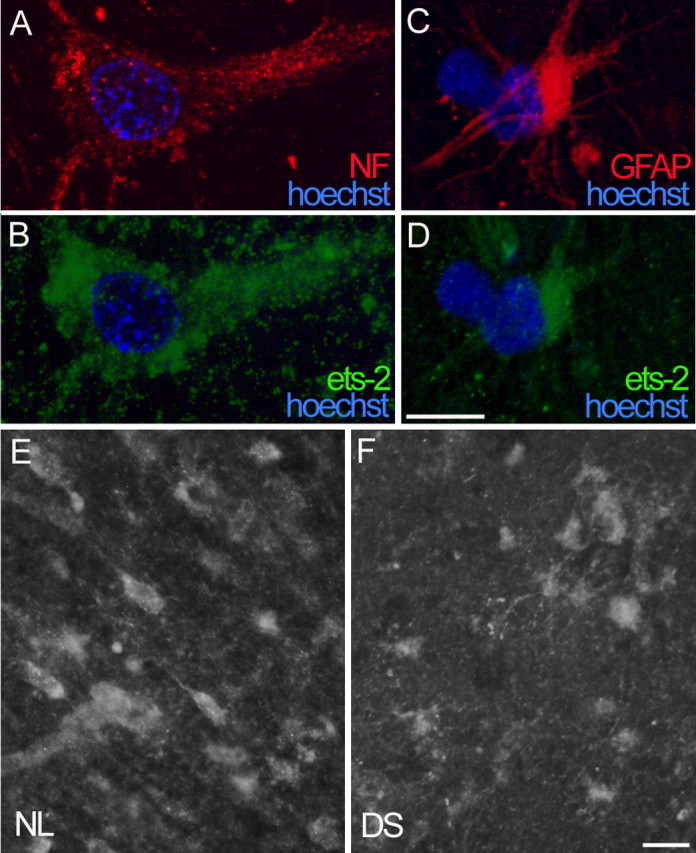
Figure 6.

Ets-2 expression in normal and DS brains. A-D, Double immunofluorescence reveals ets-2 expression (anti-ets-2, 1:100) in neurons (A, B) and astrocytes (C, D) in normal entorhinal cortex. Neuronal identity was confirmed by positive anti-neurofilament staining (1:200; A), and astrocytes were labeled with anti-GFAP (1:200; C). Cellular nuclei were counterstained with Hoechst (blue fluorescence). E, F, Lower magnification illustrates similar level of ets-2 expression in cortex of NL and DS subjects. Images in A-D are optical sections (thickness, 0.375 μm) processed with the Apotome device (Zeiss). Scale bars: A-D, 10 μm; E, F, 20 μm.
